TEMPERATURE
August resulted in slightly above average temperatures in Geelong. Compared with the latest 30-year means, Geelong was 0.7 C above the mean minimum of 6.0C and 0.6 C above the mean maximum 14.9 C.
The warmest day (18th) recorded 22.6 C and the coldest day was the 6th with a maximum of 12.1 C. Overnight minimum temperatures ranged from 2.7 C on the 5th to 13.4 C on the 19th.
WINTER TEMPERATURES
Geelong’s temperatures were warmer than the latest 30-year average during the winter months. Only June had a slightly cooler maximum temperature than normal with the whole of the winter approximately 0.5 C above average.
RAINFALL
Another average to above average rainfall month was experienced across most of the Geelong Region last month. Geelong urban area recorded around 45 mm compared to the latest 30-year average of 45.4 mm. There were 20 rain days.
The western Otway Ranges generally were slightly below average but the area closer to Geelong comparatively wetter.
WINTER RAINFALL
Geelong was much wetter than the 30-year average total of 137 mm. A total of 179 mm fell across the urban area owing to an average June and August and a very wet July. Due to the good rains the Barwon water catchments are now 59% of capacity.
OTHER FEATURES
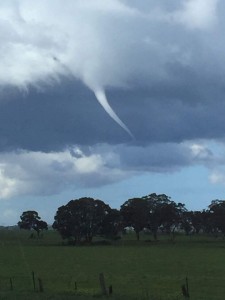
There were no severe storms in August but there were two thunder days (1st and 22nd). A tornado funnel was photographed on the 22nd southwest of Melton but it did not touch down or cause damage. [Click image to enlarge].

Melton tornado funnel 22-8-2016
RAINFALL DETAILS FOR AUGUST 2016
| GEELONG REGION |
| Location |
Total for Month (mm) |
Monthly Average (mm) |
| Aireys Inlet |
73.2 |
78.5 |
| Anakie (Granite Road) |
na |
46.0 |
| Anakie (De Motts Road) |
39.4 |
46.0 |
| Anglesea |
na |
69.0 |
| Apollo Bay |
106.3 |
124.7 |
| Bacchus Marsh |
na |
39.0 |
| Ballan |
57.0 |
55.6 |
| Ballarat |
63.6 |
76.4 |
| Bannockburn |
na |
47.0 |
| Barwon Heads |
na |
63.0 |
| Bells Beach |
na |
60.4 |
| Beeac |
29.9 |
70.1 |
| Beech Forest |
147.8 |
210.0 |
| Benwerrin |
127.8 |
164.0 |
| Birregurra |
63.4 |
80.3 |
| Boonah |
87.2 |
150.0 |
| Cape Otway |
109.2 |
102.1 |
| Colac |
na |
59.5 |
| Clifton Springs |
na |
52.0 |
| Cressy |
50.0 |
52.0 |
| Curlewis |
na |
42.0 |
| Dereel |
61.4 |
62.0 |
| Drysdale |
na |
54.9 |
| Durdidwarrah |
41.2 |
53.3 |
| Forrest |
na |
146.2 |
| Forrest (West Barwon) |
na |
146.2 |
| Inverleigh |
43.4 |
na |
| Johanna Heights |
112.0 |
na |
| Lal Lal |
39.4 |
na |
| Lavers Hill |
na |
na |
| Laverton |
35.6 |
48.0 |
| Melba Gully |
na |
n.a. |
| Melbourne (City) |
61.2 |
51.0 |
| Meredith (Darra) |
33.2 |
61.7 |
| Moriac |
72.8 |
58.0 |
| Morrisons |
na |
80.3 |
| Mt Cowley |
128.0 |
185.0 |
| Mt Gellibrand |
57.4 |
na |
| Mt Mercer |
43.8 |
70.3 |
| Mt Sabine |
61.0 |
210.0 |
| Ocean Grove |
na |
45.0 |
| Pollocksford |
51.2 |
n.a. |
| Point Lonsdale |
na |
59.0 |
| Queenscliff |
na |
61.4 |
| Scotsburn |
53.6 |
80.3 |
| Shelford |
38.2 |
51.0 |
| Sheoaks |
36.6 |
47.0 |
| Skipton |
na |
48.0 |
| St Leonards |
na |
60.0 |
| Sutherlands Creek |
47.5 |
46.0 |
| Torquay |
na |
64.0 |
| Wallington |
49.0 |
56.0 |
| Warncoort |
na |
89.8 |
| Winchelsea |
na |
57.2 |
| Wooloomanata |
26.4 |
47.2 |
| You Yangs |
32.5 |
38.0 |
|
| GEELONG SUBURBS |
| Location |
Total for Month (mm) |
Monthly Average (mm) |
| Avalon |
43.0 |
48.3 |
| Bell Post Hill |
52.0 |
50.9 |
| Belmont |
39.5 |
49.4 |
| Breakwater |
52.4 |
46.9 |
| Connewarre |
na |
44.3 |
| Corio |
34.9 |
42.0 |
| East Geelong |
na |
47.3 |
| Grovedale |
49.5 |
51.5 |
| Grovedale South |
50.8 |
51.5 |
| Hamlyn Heights |
48.8 |
46.0 |
| Herne Hill |
48.5 |
46.0 |
| Highton |
na |
51.5 |
| Lara |
41.8 |
39.6 |
| Leopold |
54.0 |
49.5 |
| Leopold East |
57.4 |
49.5 |
| Manifold Heights |
58.1 |
46.0 |
| Moolap |
51.0 |
45.0 |
| Waurn Ponds |
52.2 |
48.1 |
| Whittington |
50.0 |
51.0 |
| Urban Area Average |
45.0 |
45.4 |
|

