TEMPERATURE
Geelong was warmer than normal by 0.9 degrees C. Daily maximums averaged 26.3 C and minimums 15.0 C, compared to the latest 30-year averages of 25.2 C and 14.3 C respectively.
On the hottest day, the 10th, 34.9 C was recorded at the Geelong AWS, and there were 5 days over 30 C during the month.
RAINFALL
Very much lower than normal rainfall was recorded across the Geelong urban area. Most suburbs received around 5-6 mm, some 30 mm or more below the average for the month. Most of the region, from the Otways to the Bellarine Peninsula, recorded much less than half the 30-year normal.
There were only 7 rain days; this is average but most daily maximum falls were below 2 mm.
OTHER FEATURES
A short but remarkable event occurred on the afternoon of Saturday, 10th February. A trough-like squall only 5-10 km wide crossed northern and central Geelong. In the 5-minute event, many trees were snapped, power disrupted, roofs smashed and other injuries and damage were caused by wild wind gusts well above the 59 km/h maximum recorded at the Racecourse.
The severe storm spread lightning, thunder, a little rain, large hail, mayhem and debris across the urban area roughly north of Aberdeen Street around 4.30 pm.
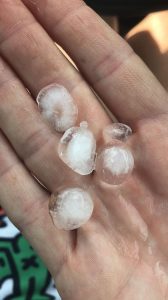
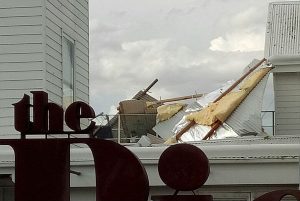
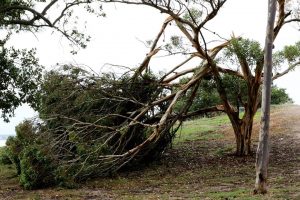
The photos below, courtesy of internet users, typified a severe thunderstorm downburst as it crossed northern Geelong from west to east.
 Hail larger than 1 cm across.
 Roof removed.
 Much tree damage
One thunder day was reported on the 10th and 2 very strong wind gusts (74 and 69 km/h) occurred on the 14th and 28th.
A minor earth tremor (Richter 1.9) was felt in the Inverleigh-Murgheboluc area on the 1st but no damage was reported.
SUMMER SUMMARY
All 3 months were warmer than normal but no new records were set. Summer was drier than the latest 3-year average; only January was wetter than normal.
RAINFALL DATA
|
|
|||||||||||||||||||||||||||||||||||||||||||||||||||||||||||||||||||||||||||||||||||||||||||||||||||||||||||||||||||||||||||||||||||||||||||||||||||||||||||||||||||||||||||||||||||||||||||||||||||||||||||||||||||||||||
