SUMMARY
Contrary to quite a lot of public opinion urban Geelong was slightly drier than average in July and warmer than average by about 0.8 degrees C. The public opinion was probably based on Geelong’s cold and very windy conditions and 18 rain days which yielded less than the latest 30-year average. Nevertheless the figures show a warmer and drier month than last month – and July is supposed to be our coldest month!
TEMPERATURE
Average minimum daily temperatures were 6.6 C for minimums and 14.8 C for maximums. This compares to 5.8 C and 14.0 C over the last 30 years, therefore the warmer than average temperatures have resulted. The warmest day was the 27th with a top temperature of 19.1 C and on the coldest day, the 11th, the mercury only rose to 9.6 C.
Geelong’s coldest minimum was 0.2 C on the 2nd, the only day of frost for the month.
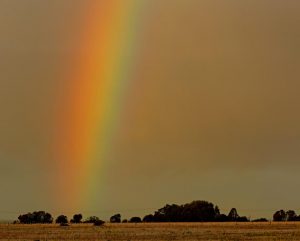
 Photo taken by Dan Atkinson on the Great Ocean Road.
RAINFALL
Geelong’s total rainfall for the month averaged around 40 mm across the urban area. This is 5 mm below the 45 mm average for July. Breakwater’s total rainfall was 41.4 mm and this varied from 65.2 at Armstrong Creek to just 26.0 mm at Avalon.
Over the 18 rain days the wettest was 10 mm on the 29th.
OTHER FEATURES
Fierce, lashing winds only deposited 4.8 mm of rain on the 17th, but winds exceeding 120 km/h at Pt Wilson, 97 km/h at Queens Park and 85 km/h at Breakwater created havoc across the city, as a vicious cold front causing trees, buildings, cars and infrastructure damage made its mark as Geelong’s second severe storm for the year.
All up there were six strong wind gusts over 60 km/h in July, most of them originating from the northwest as cold fronts attacked the region.
There were two thunder – lightning days (5th and 17th) but only one frost on the 2nd.
Water catchments for the Barwon – Moorabool system now total 54% of capacity.
RAINFALL DATA
| GEELONG REGION | ||
| Location | Total for Month (mm) |
Monthly Average (mm) |
| Aireys Inlet | 71.0 | 75.7 |
| Anakie West | 42.1 | na |
| Apollo Bay | 211.4 | 128.3 |
| Bacchus Marsh | 36.6 | 34.3 |
| Ballan | 58.0 | 47.3 |
| Ballarat | 67.4 | 68.0 |
| Balliang East | 26.0 | 33.5 |
| Bannockburn | 49.8 | 43.0 |
| Barwon Downs | 99.0 | 89.0 |
| Beech Forest (Fly) | 252.4 | 201.2 |
| Bellbrae | na | 63.7 |
| Bells Beach | 41.2 | 63.7 |
| Beeac | na | 63.2 |
| Benwerrin | 140.8 | na |
| Birregurra | 84.6 | 71.4 |
| Boonah | 101.2 | na |
| Breamlea | 34.0 | na |
| Cape Otway | 136.2 | 105.8 |
| Colac | 114.2 | na |
| Colac (Mt Gellibrand) | 66.0 | na |
| Clifton Springs | 28.8 | 54.0 |
| Cressy | na | 78.0 |
| Curlewis Golf Club | 25.0 | 49.0 |
| Dereel | 73.8 | 52.0 |
| Forrest (West Barwon) | 140.0 | 131.3 |
| Inverleigh | 59.2 | 52.8 |
| Lal Lal | 61.2 | 70.0 |
| Laverton | 17.6 | 42.0 |
| Lorne | 157.6 | 115.1 |
| Melbourne (City) | 19.4 | 49.0 |
| Melton | 18.6 | 49.0 |
| Meredith (Darra) | 46.2 | 49.0 |
| Moriac | 61.2 | 57.0 |
| Mt Cowley | 151.8 | na |
| Mt Mercer | 71.8 | na |
| Mt Sabine | 83.4 | na |
| Ocean Grove | 39.6 | 59.0 |
| Point Lonsdale | 31.8 | 56.0 |
| Queenscliff | 24.8 | 56.6 |
| Scotsburn | 39.2 | 56.6 |
| Shelford | 51.4 | 45.0 |
| Sheoaks | 44.8 | 45.0 |
| St Leonards | 31.0 | 55.0 |
| Sutherlands Creek | 33.2 | na |
| Warncoort | 114.0 | 65.0 |
| Wallington | na | 55.0 |
| Wensleydale | 72.6 | 50.2 |
![]()
| GEELONG SUBURBS | ||
| Location | Total for Month (mm) |
Monthly Average (mm) |
| Armstrong Creek | 65.2 | 41.4 |
| Bell Park | 35.4 | 47.2 |
| Belmont | 52.0 | 47.5 |
| Breakwater Racecourse | 41.4 | 46.0 |
| Corio | 44.0 | 40.0 |
| Drumcondra | na | 51.0 |
| Grovedale | 40.5 | 44.2 |
| Grovedale South | 54.7 | 47.5 |
| Hamlyn Heights | 42.0 | 47.5 |
| Herne Hill | 36.0 | 46.0 |
| Highton | 46.4 | 49.2 |
| Lara | 41.8 | 38.6 |
| Leopold North | 43.0 | 47.4 |
| Leopold East | 39.4 | 47.4 |
| Manifold Heights | 39.0 | 48.6 |
| Moolap | 35.6 | 43.0 |
| Waurn Ponds | 50.6 | 43.0 |
| Whittington | 45.6 | 49.5 |
| Wooloomanata | 26.8 | 38.6 |

