SUMMARY
Geelong was drier (80% of average rainfall) and slightly cooler than average (by around 0.1º C) during August. Yearly rainfall to date is 284 mm, compared to the average January to August total of 321 mm.
WINTER SUMMARY
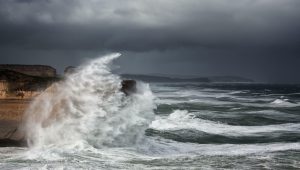
Overall winter was slightly drier than average (131 mm compared to 139 mm) but just as cool as the mean temperature of 10.3º C. Strong winds made it feel much colder. Dan Atkinson’s photo below was taken on the beach along the Great Ocean Road during a recent winter storm. Please click to enlarge.
Photo below (by Doug Smail) in mid-August shows Deep Lake at sunset with unpromising cloud cover.
AUGUST TEMPERATURE
Geelong was slightly cooler than average by 0.1°C. Minimums averaged 6.0° C – spot on the long-term average, and maximums 14.8° C which was 0.2° cooler than normal. This means that the mean temperature for August was 0.1° C cooler than the long-term normal.
The warmest day was the 10th with a maximum temperature of 19.6°. The coldest day was the 28th when the mercury only rose to 11.5° C. Despite there being a total of 7 minimums of 2.5° C or less, the only frost occurred on the 29th with a minimum of 0.4° C.
AUGUST RAINFALL
Across the urban area Geelong received around 36 mm. This was 10 mm below average for the month. The Bellarine Peninsula received a similar percentage of the normal long-term average, but the Otways recorded much more than their normal figures. Beech Forest recorded a magnificent 296 mm, well above their 212 mm average total.
The wettest day in Geelong resulted in a measly 8.6 mm on the 19th and there were 18 rain days.
OTHER FEATURES
There were four days of strong wind gusts at Geelong AWS over 60 km/h. Two days of 70 km/h gusts occurred on the 15th and the 18th, with much higher gusts on both days at Queens Park, Armstrong Creek, Avalon, Pt Wilson, Highton and Mt Gellibrand. The strongest gust was 93 km/h at Avalon on the 18th.
There were two days of hail on the 18th and 19th, and two thunder / lightning days on the 19th and 26th. Despite this and the strong winds there were no severe storms in the region.
RAINFALL DETAILS FOR AUGUST 2018
|
|
|||||||||||||||||||||||||||||||||||||||||||||||||||||||||||||||||||||||||||||||||||||||||||||||||||||||||||||||||||||||||||||||||||||||||||||||||||||||||||||||||||||||||||||||||||||||||||||||||||||||||||||||||||||||||||||||||


