SUMMARY
Geelong in October was a lot drier and a little warmer than average by about 1.5 degrees C. Average daily minimum temperature was 9.7 C (long-term mean 8.4 C) and average daily maximum was 21.1 C (long-term mean 19.4 C).
TEMPERATURE
Temperatures averaged over 1.5 degrees C warmer than the 30-year mean, although no day reached 30 degrees C. The top temperature reached 29.3 C on the 19th and on the coldest day (the 10th) it reached only 15.3 C.
On the coldest night (the morning of the 1st) the mercury sank to 4.0 C.
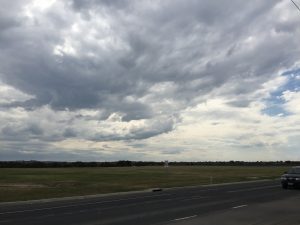
Fine, dry weather was predominant and even promising cloud patterns usually did not deliver much rain.
See photos below. (Click to enlarge).
RAINFALL
A very poor rainfall was the result of only 9 rain days (the average is 14 days). The El Nino effect in Geelong seems well established this year as most of Geelong only measured around 26 mm or half the normal 50.8 mm.
During the 6-day period from the 16th to the 21st most of the rain fell across the region. Monthly figures varied from 14 mm at Lara to 39 mm in North Geelong.
OTHER FEATURES
In a rather uneventful month – not typical of many Octobers – there were no frosts, no strong wind gusts over 60 km/h, no flash floods, no severe storms and only one thunder-lightning day on the 16th.
RAINFALL DATA
![]()
| GEELONG SUBURBS | ||
 Location Location |
Total for Month (mm) |
|
| Armstrong Creek | 21.8 | 55.9 |
| Avalon | 21.8 | 40.9 |
| Bell Post Hill | 27.4 | 55.9 |
| Belmont | 27.5 | 57.0 |
| Breakwater Racecourse | 25.0 | 51.0 |
| Ceres | na | 50.0 |
| Charlemont | 27.0 | 57.5 |
| Corio | 28.4 | 54.0 |
| Grovedale | 30.5 | 52.8 |
| Grovedale South | 29.0 | 56.3 |
| Hamlyn Heights | na | 50.6 |
| Highton | 22.5 | 56.1 |
| Lara | 14.0 | 46.0 |
| Leopold | 36.0 | 64.0 |
| Leopold East | 32.7 | 64.0 |
| Manifold Heights | na | 57.0 |
| Moolap | 24.2 | 57.0 |
| Queens Park | 22.0 | 51.0 |
| Waurn Ponds | 21.0 | 50.0 |
| Whittington | 25.2 | 53.5 |
| Urban Geelong Average | 26.0 | 52.3 |


