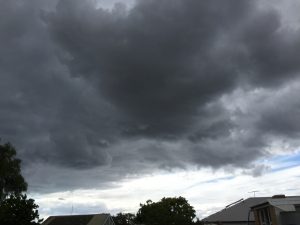
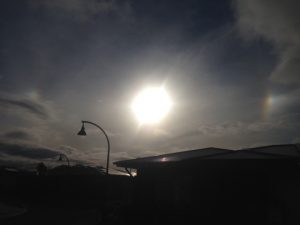
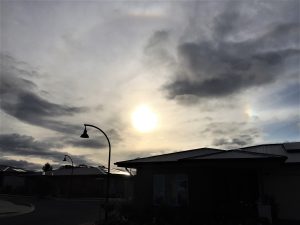
Twin sundogs west of Geelong on 17th at 7.10 pm. Both photos L. Smail.
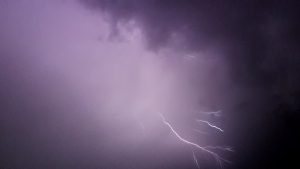 Intra-cloud lightning Grovedale 14th
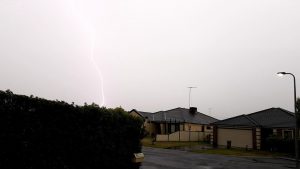 Daylight lightning 12th
The above two photos courtesy Doug Lindsay.
SUMMARY
Geelong was much warmer and much wetter in December, ending a dry spell of the previous five months. Average daily temperatures were also around 2 degrees greater than the 30-year average, almost a record.
TEMPERATURE
Daily maximums averaged 1.7 degrees higher than average (25.3 C compared to 23.6 C) and minimums averaged 2.4 degrees higher (14.3 C compared to 11.9 C).
It was Geelong’s equal highest average minimum temperature for December since records began in 1902. Overall it was Geelong’s third highest December average.
RAINFALL
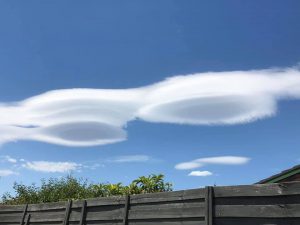
Lenticularis clouds do not bring rain to Geelong but are caused by winds swirling over the Otway Ranges as they intercept moist air on its journey to the northeast and Geelong. December’s well above average rainfall was a welcome addition to the region’s gardens if not the water catchments which still sit around 56% of capacity. Rain fell on 16 days in Geelong.
The major rain event occurred when an upper and surface low combined between the 13th and the 17th and brought 40 mm to the Geelong urban area although there were much higher falls in other areas, eg, on the 15th at least 32 mm fell at Leopold.
OTHER FEATURES
As shown in the above photos, “sundogs” or mock suns (otherwise known as parhelions) were photographed west of Geelong on the 17th. These coloured spots of light, often surrounded by a rainbow or white circle, is often seen in Antarctic regions but only rarely in Geelong. They occur due to refraction of the sun’s light through hexagonal ice crystals and are usually seen in conjunction with high level cirrus and cirrostratus clouds.
There were 4 thunder days (8th, 12th, 14th and 15th) and one strong wind day (63 km/h on the 3rd), although at least two other days had gusts of 59 km/h.
Fires at Little River on the 7th caused damage but no loss of life.
RAINFALL DATA
| GEELONG REGION | ||
| Location | Total for Month (mm) | Monthly Average (mm) |
| Aireys Inlet | 54.6 | 34.0 |
| Anakie | 45.3 | 55.0 |
| Anglesea | 50.8 | 48.0 |
| Apollo Bay | na | 63.2 |
| Bacchus Marsh | 58.6 | 47.1 |
| Ballan | 102.4 | 45.9 |
| Ballarat | 104.0 | 51.6 |
| Bannockburn | 37.0 | 42.0 |
| Barwon Heads Golf Club | 56.6 | 47.0 |
| Bells Beach | 41.0 | 54.0 |
| Beeac | na | 42.4 |
| Beech Forest (Fly) | na | 96.4 |
| Benwerrin | 115.4 | n.a. |
| Birregurra | 55.0 | 42.4 |
| Boonah | 90.0 | n.a. |
| Cape Otway | 45.0 | 52.7 |
| Colac | 53.4 | 46.6 |
| Cressy | na | na |
| Curlewis | 53.4 | 44.2 |
| Dereel | 61.0 | 44.2 |
| Drysdale | na | 44.7 |
| Gerangamete | 53.6 | n.a. |
| Inverleigh | 64.2 | 45.5 |
| Lal Lal | 80.4 | n.a. |
| Laverton | 106.0 | 45.0 |
| Lethbridge | 35.2 | 55.9 |
| Melbourne (City) | 104.8 | 59.0 |
| Melton | 72.6 | 44.0 |
| Meredith (Darra) | 59.0 | 51.8 |
| Moriac | 64.2 | n.a. |
| Mt Buninyong | 77.6 | n.a. |
| Mt Cowley | 155.8 | 85.0 |
| Mt Gellibrand | 51.6 | na |
| Mt Mercer | 55.8 | n.a. |
| Mt Sabine | 85.6 | 90.0 |
| Point Lonsdale | 46.0 | 45.0 |
| Ocean Grove | 59.6 | 45.5 |
| Queenscliff | 50.0 | 43.4 |
| Shelford | 50.0 | 45.0 |
| Sheoaks | 37.8 | 29.2 |
| Skipton | 49.2 | 46.4 |
| St Leonards | 52.8 | 45.0 |
| Sutherland’s Creek | 58.8 | na |
| Warncoort | 63.5 | na |
| Wallington | 66.0 | n.a. |
| West Barwon Dam | na | 65.0 |
| Wensleydale | 75.6 | 41.1 |
| Wooloomanata | 53.8 | n.a. |
| GEELONG SUBURBS | ||
| Location | Total for Month (mm) | Monthly Average (mm) |
| Armstrong Creek | 46.8 | 28.1 |
| Avalon | 31.6 | 28.1 |
| Batesford | 63.2 | 44.0 |
| Bell Post Hill | 52.2 | 47.8 |
| Belmont | 34.0 | 44.0 |
| Breakwater Racecourse | 61.0 | 41.0 |
| Charlemont | 61.6 | na |
| Corio | 52.6 | 42.0 |
| Drumcondra | 59.0 | 42.0 |
| Grovedale | 57.2 | 44.2 |
| Grovedale South | 57.0 | 44.2 |
| Hamlyn Heights | 55.6 | 42.0 |
| Herne Hill | 43.0 | 42.0 |
| Highton | 58.0 | 44.2 |
| Highton West | 65.8 | 44.0 |
| Lara | 38.6 | 42.0 |
| Leopold | 72.0 | 53.9 |
| Leopold North | 71.0 | 42.0 |
| Manifold Heights | 50.3 | 47.8 |
| Moolap | 66.8 | 38.0 |
| Moolap Salt Works | 47.8 | 42.2 |
| North Shore | 54.0 | 44.0 |
| Waurn Ponds | 47.2 | 42.2 |
| Whittington | 66.8 | 42.0 |
| Urban Area Average | 58.0 | 41.9 |

