SUMMARY
Warmer and much drier than normal was February. Only 6.4 mm fell at Geelong AWS and less in Moolap and Lara; the month was unremarkable with only one storm and two days of wind gusts over 60 km/h.

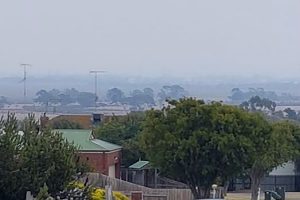
Lingering smoke from Gippsland and Tasmanian fires covers much of Geelong on the 5th.
TEMPERATURE
Average daily maximum temperature was 26.2 C and average minimum was 14.4 C. This was about 0.6 C higher than the 30-year normal. There were seven days over 30 C and the maximum was 39.9 C on the 28th. Lowest minimum overnight temperature was 9.7 C on the 13th and 18.9 C highest minimum on the 7th.
RAINFALL
The Geelong urban area averaged around 9 mm for the month, but this ranged from 4.8 mm at Moolap Salt Works to 12.6 mm at Highton. There were only seven days of rain and at the time of writing no rain had fallen for two weeks. The Bureau of Meteorology sees a continuation of this pattern into early next week.
OTHER FEATURES
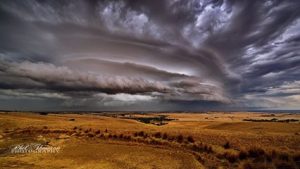
“caption id=”attachment_2159″ align=”alignleft” width=”300″] Storm clouds over Ceres on the 6th. Photo Phil Thomson.[/caption]
There was only one storm in the immediate region (1 thunder day on the 6th) and only a few millimetres fell in Geelong on that day. Two wind gusts over 60 km/h on the 9th and 12th and a smoke-filled sky on the 5th relieved some of the boredom caused by another hotter and drier month for 2019.
SUMMER SUMMARY
Summer was hotter than the 30-year average by around 1.7 C and drier than average by about 47 mm. None of this is unprecedented and the last time we had such a hot and dry summer was as recently as last year (despite a little more rainfall on that occasion).
RAINFALL DATA
| GEELONG REGION |
| Location |
Total for Month (mm) |
Monthly Average (mm) |
| Aireys Inlet |
16.2 |
38.9 |
| Anakie |
24.6 |
44.0 |
| Anglesea |
11.8 |
50.3 |
| Bacchus Marsh |
17.0 |
42.8 |
| Ballan |
15.4 |
48.7 |
| Ballarat |
12.4 |
44.7 |
| Bannockburn |
na |
35.0 |
| Barwon Heads Golf Club |
12.6 |
41.0 |
| Bells Beach |
na |
30.4 |
| Bellbrae |
na |
30.4 |
| Beeac |
4.8 |
37.6 |
| Beech Forest (Fly) |
64.0 |
64.0 |
| Birregurra |
na |
36.3 |
| Boonah |
27.2 |
40.0 |
| Cape Otway |
38.8 |
41.8 |
| Colac |
26.0 |
43.8 |
| Clifton Springs |
na |
39.4 |
| Cressy |
na |
35.6 |
| Curlewis |
na |
37.3 |
| Curlewis Golf Club |
3.6 |
37.4 |
| Drysdale |
7.0 |
37.4 |
| Durdidwarrah |
na |
48.3 |
| Inverleigh |
5.8 |
42.9 |
| Laverton |
16.0 |
49.0 |
| Lal Lal |
8.8 |
49.8 |
| Melton |
9.6 |
na |
| Melbourne (City) |
18.6 |
48.0 |
| Meredith (Darra) |
21.2 |
47.2 |
| Moriac |
na |
35.0 |
| Mt Cowley |
33.2 |
49.6 |
| Mt Mercer |
0.6 |
43.8 |
| Mt Sabine |
17.2 |
48.8 |
| Ocean Grove |
na |
32.0 |
| Pollocksford |
na |
34.0 |
| Pt Lonsdale |
7.0 |
38.1 |
| Queenscliff |
2.4 |
38.0 |
| Scotsburn |
10.0 |
34.0 |
| Shelford |
11.8 |
34.0 |
| Sheoaks |
29.6 |
34.0 |
| Skipton |
16.8 |
34.0 |
| St Leonards |
0.2 |
40.0 |
| Sutherlands Creek |
na |
44.0 |
| Wensleydale |
22.6 |
34.0 |
| Wallington |
na |
38.0 |
| Wooloomanata |
10.0 |
37.5 |
| West Barwon Dam |
na |
52.3 |
| Werribee |
4.8 |
34.5 |
|
 |
| GEELONG SUBURBS |
| Location |
Total for Month (mm) |
Monthly Average (mm) |
| Armstrong Creek |
12.0 |
37.3 |
| Avalon |
8.8 |
37.3 |
| Bell Post Hill |
11.0 |
35.8 |
| Belmont |
9.0 |
39.0 |
| Breakwater |
6.4 |
31.0 |
| Charlemont |
na |
39.8 |
| Corio |
8.4 |
36.0 |
| Grovedale |
8.0 |
36.3 |
| Grovedale South |
8.5 |
39.1 |
| Hamlyn Heights |
na |
38.2 |
| Herne Hill |
na |
34.0 |
| Highton |
12.8 |
39.0 |
| Lara |
5.6 |
37.6 |
| Leopold East |
10.4 |
40.7 |
| Leopold North |
na |
40.7 |
| Manifold Heights |
na |
37.4 |
| Moolap |
5.6 |
38.8 |
| North Shore |
12.4 |
36.0 |
| Queens Park |
12.6 |
31.0 |
| Whittington |
7.2 |
36.1 |
| Urban Area Average |
9.0 |
37.1 |
|
 Storm clouds over Ceres on the 6th. Photo Phil Thomson.[/caption]
