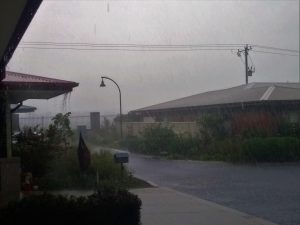
Very heavy thunderstorms on the 18th at Barwarre Gardens. Photo courtesy David Ridley.

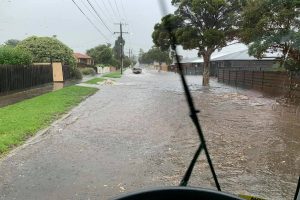
Flooding after heavy rain at Bell Post Hill on the 14th. Photo Bay 93.9.

Mammatus cloud under a thunderstorm on the 14th. Photo Lindsay Smail.
SUMMARY
An extraordinary February – cooler than average, much wetter than normal, humid, often overcast and a severe storm characterised the month.
TEMPERATURE
Overnight temperatures were 1.0 C above average but daily maximums were 2.7 C cooler than normal, leading to a monthly mean of 0.9 C below the average.
There was only one day over 30 degrees (30.1 C on the 23rd) and the warmest overnight temperature was 22.2 C on the 1st.
RAINFALL
The whole of the Geelong and western Victoria experienced well above average rainfall with at least three thunderstorms. Urban Geelong totalled in excess of 90 mm, nearly 3 times the normal, not completely untypical of summer weather when heavy downpours sometimes occur in February.
OTHER FEATURES
A severe storm occurred in the northern suburbs on the 14th when most of the urban area experienced some heavy rain and Corio suffered at least 44 mm in one hour, leading to widespread flash flooding, power failures and damage to homes and businesses.
Another very heavy downpour occurred on the 18th when 37.6 mm was recorded at Geelong AWS in Breakwater and 46.4 mm at Marshall, although not classified as severe, despite some flash flooding.
Three thunder days occurred on the 14th, 18th and 24th and only one day of extreme wind gusts – an easterly of 69 km/h on the 9th, quite unusual.
At least 15 days were overcast, hazy or misty which helped overnight temperatures stay high and day temperatures lower than average by around 2.7 C.
SUMMER SUMMARY
Overall summer was just fractionally warmer than the 30-year average by around 0.1 C degrees and wetter than average by around 62 mm.
RAINFALL DATA
| GEELONG REGION |
| Location |
Total for Month (mm) |
Monthly Average (mm) |
| Aireys Inlet |
73.6 |
38.9 |
| Anakie |
110.1 |
44.0 |
| Anglesea |
69.8 |
50.3 |
| Bacchus Marsh |
41.6 |
42.8 |
| Ballan |
78.2 |
48.7 |
| Ballarat |
45.6 |
44.7 |
| Bannockburn |
89.4 |
35.0 |
| Barwon Heads Golf Club |
67.2 |
41.0 |
| Bells Beach |
74.4 |
30.4 |
| Bellbrae |
70.8 |
30.4 |
| Beeac |
|
37.6 |
| Beech Forest (Fly) |
104.0 |
64.0 |
| Boonah |
88.2 |
40.0 |
| Cape Otway |
45.4 |
41.8 |
| Colac |
37.5 |
43.8 |
| Cressy |
na |
35.6 |
| Curlewis |
78.6 |
37.3 |
| Curlewis Golf Club |
50.0 |
37.4 |
| Drysdale |
110.8 |
37.4 |
| Dereel |
83.1 |
48.3 |
| Inverleigh |
na |
42.9 |
| Laverton |
49.8 |
49.0 |
| Lal Lal |
na |
49.8 |
| Melton |
68.8 |
na |
| Melbourne (City) |
76.2 |
48.0 |
| Meredith (Darra) |
62.0 |
47.2 |
| Moriac |
na |
35.0 |
| Mt Cowley |
na |
49.6 |
| Mt Mercer |
80.0 |
43.8 |
| Mt Sabine |
na |
48.8 |
| Ocean Grove |
78.6 |
32.0 |
| Pollocksford |
52.6 |
34.0 |
| Pt Lonsdale |
58.8 |
38.1 |
| Queenscliff |
69.6 |
38.0 |
| Scotsburn |
109.0 |
34.0 |
| Shelford |
na |
34.0 |
| Sheoaks |
101.8 |
34.0 |
| Skipton |
na |
34.0 |
| St Leonards |
68.2 |
40.0 |
| Sutherlands Creek |
87.6 |
44.0 |
| Wensleydale |
67.4 |
34.0 |
| Wallington |
na |
38.0 |
| Wooloomanata |
93.4 |
37.5 |
| West Barwon Dam |
na |
52.3 |
| Werribee |
53.0 |
34.5 |
|
 |
| GEELONG SUBURBS |
| Location |
Total for Month (mm) |
Monthly Average (mm) |
| Armstrong Creek |
70.8 |
37.3 |
| Avalon |
60.4 |
37.3 |
| Bell Post Hill |
81.8 |
35.8 |
| Belmont |
61.5 |
39.0 |
| Breakwater |
83.4 |
31.0 |
| Charlemont |
na |
39.8 |
| Corio |
117.8 |
36.0 |
| East Geelong |
72.0 |
36.3 |
| Grovedale |
88.5 |
36.3 |
| Grovedale South |
72.7 |
39.1 |
| Hamlyn Heights |
na |
38.2 |
| Herne Hill |
80.0 |
34.0 |
| Highton |
78.9 |
39.0 |
| Lara |
91.6 |
37.6 |
| Leopold East |
89.8 |
40.7 |
| Leopold North |
86.0 |
40.7 |
| Manifold Heights |
89.1 |
37.4 |
| Marshall |
102.2 |
36.3 |
| Moolap |
94.0 |
38.8 |
| North Shore |
122.4 |
36.0 |
| Queens Park |
85.6 |
31.0 |
| Whittington |
87.2 |
36.1 |
| Urban Area Average |
90.0 |
36.4 |
|


