SUMMARY
March was a very average month according to temperatures but wetter than the latest 30-year average. Average minimums were about 0.4 degrees above normal and 0.5 degrees below maximums.
TEMPERATURE
Daily minimum figures averaged 12.9C and maximums averaged 23.0C. Minimums were 0.4C higher than the monthly average and 0.5C below average, hence the average was almost equal with the 30-year temperature March average.
There were 4 days above 30 degrees, including 32.5C on the 1st and 19th. The warmest overnight temperature was 18.9C on the 13th; the coolest night was 9.7C on the 27th, and the coolest day 17.2C on the 25th.
RAINFALL
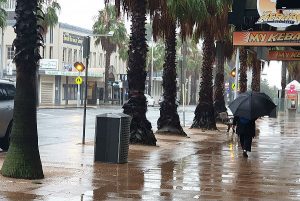
Urban Geelong received an average of 35 mm over 7 days with a March 30-year average of 26.5 mm. The wettest day recorded 17.4 mm on the 5th. Most of the Otways region were drier than usual but the Bellarine Peninsula was generally wetter.
OTHER FEATURES
On 19 days overcast conditions occurred across the city and the maximum wind gust recorded on the 13th (63 km/h at Beakwater). Two thunder / lightning days happened on the 19th and 29th, but no severe storms.
RAINFALL DATA
GEELONG REGION |
||
Location |
Total for Month (mm) |
Monthly Average (mm) |
| Aireys Inlet | 29.2 | 45.7 |
| Anakie West | na | 35.6 |
| Anglesea | 28.4 | 41.0 |
| Apollo Bay | 39.6 | 69.6 |
| Bacchus Marsh | 37.2 | 26.0 |
| Ballan | 45.2 | 40.8 |
| Ballarat | 27.2 | 44.4 |
| Balliang East | 33.2 | 24.4 |
| Barwon Heads | 28.2 | 43.0 |
| Beech Forest (Fly) | 73.6 | 100.6 |
| Bellbrae | 24.0 | 37.7 |
| Bells Beach | 31.6 | 37.7 |
| Beeac | na | 40.4 |
| Benwerrin | na | 65.0 |
| Boonah | 32.0 | 35.0 |
| Cape Otway | 34.4 | 55.8 |
| Colac | 18.0 | 44.2 |
| Cressy | na | 45.0 |
| Curlewis | 15.7 | 35.6 |
| Curlewis Golf Club | 25.2 | 35.6 |
| Dereel | 34.3 | 46.0 |
| Drysdale | 51.8 | 59.4 |
| Forrest (West Barwon) | 22.8 | 69.5 |
| Inverleigh | 26.8 | 43.0 |
| Lal Lal | na | 54.4 |
| Laverton | na | 36.0 |
| Lorne | 28.6 | 36.0 |
| Melbourne (City) | na | 52.0 |
| Melton | 47.2 | 52.0 |
| Meredith (Darra) | 41.2 | 51.6 |
| Moriac | na | 35.0 |
| Mount Gellibrand | 19.0 | 50.8 |
| Mount Cowley | na | 66.1 |
| Mount Mercer | 37.4 | 50.5 |
| Mount Sabine | na | 110.2 |
| Ocean Grove | na | 43.0 |
| Point Lonsdale | 25.6 | 45.6 |
| Queenscliff | 36.2 | 44.5 |
| Scotsburn | 42.4 | 58.0 |
| Shelford | na | 38.0 |
| Sheoaks | 29.0 | 38.0 |
| Skipton | na | 38.0 |
| St Leonards | 68.0 | 45.0 |
| Sutherlands Creek | 33.0 | 35.0 |
| Werribee | 45.6 | 30.8 |
| Werribee South | 29.0 | 30.8 |
GEELONG SUBURBS |
||
| Location | Total for Month (mm) | Monthly Average (mm) |
| Armstrong Creek | 35.2 | 30.3 |
| Avalon | 31.8 | 31.0 |
| Bell Post Hill | 33.0 | 37.4 |
| Belmont | na | 31.9 |
| Breakwater | 31.6 | 28.1 |
| Charlemont | na | 27.0 |
| Corio | 34.4 | 35.0 |
| Grovedale | 36.0 | 32.0 |
| Grovedale West | 32.8 | 31.7 |
| Grovedale South | 34.2 | 31.7 |
| Hamlyn Heights | 33.8 | 35.0 |
| Herne Hill | 33.0 | 32.0 |
| Highton | 38.0 | 32.0 |
| Lara | 34.4 | 36.6 |
| Leopold | 36.0 | 32.9 |
| Leopold East | 41.1 | 32.5 |
| Manifold Heights | 37.8 | 32.5 |
| Marshall | 36.4 | 32.5 |
| Moolap | 30.4 | 32.5 |
| North Shore | 35.0 | 30.3 |
| Queens Park | 34.2 | 32.0 |
| Whittington | 33.0 | 32.0 |
| Urban Area Average | 35.0 | 28.0 |


