SUMMARY
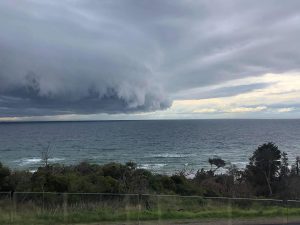
April was much wetter than normal and quite cooler than the latest 30-year average figures. Double the normal rainfall for the month, and cooler than average for maximum temperatures and just warmer than overnight minimums gave the wetter and cooler summary.
TEMPERATURE
Maximum figures averaged 18.8 C compared to the 30-year average 20.5 C, and minimums averaged 10.4 C compared to 9.9 C. This means the days were 1.7 C cooler than normal and the nights were 0.5 C warmer, therefore the month was cooler by 0.6 C than the April average.
Warmest day was 25.4 C on the 15th and the coolest maximum only reached 14.8 C on the 12th, whereas the warmest night recorded 13.9 C on the 24th and the coolest overnight reached 5.0 C on the 28th.
RAINFALL
Geelong has reached the third wettest start of the year since records began in 1871. 1928 was Geelong’s wettest start (337 mm) and 1924 was the second wettest first four months (320 mm). The total reached 290 mm and the Bureau has predicted a wetter than normal winter this year.
Urban Geelong recorded around 90 mm for April and all parts of the region from the Bellarine Peninsula, the Golden Plains the Otway Ranges and the Surf Coast received well above average rain for the month.
On the wettest 24 hour period, the 4th, 24.2 mm fell at Breakwater AWS. There were 16 rain days. Water catchments averaged 55%.
OTHER FEATURES
There were three days of very strong winds on the 4th, 5th and 11th at Breakwater, when maximum gusts exceeded 60 km/h and 70 km/h was measured on the 4th. At Avalon 85 km/h was received on the 4th, 82 km/h on the 5th and 80 km/h on the 11th.
There was one thunder / lightning day on the 3rd.


