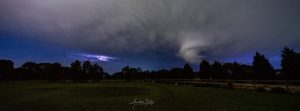
Tornado over Waurn Ponds and Armstrong Creek taken from Lara by Annette Kelly

Severe Storm damage in Waurn Ponds and Armstrong Creek on 20th May. Photos Geelong Advertiser.
SUMMARY
May was drier but cooler than the latest 30-year averages. The major feature of the month was an official tornado which occurred at 1.10 am on the 20th. See photos above.
TEMPERATURES
Geelong saw below average temperatures about 0.8 C lower than normal. Minimums averaged 7.5 C and maximums averaged 16.5 C, compared with the normals of 8.3 C and 17.2 C.
There were only two days over 20 C (max 22.3 C on the 7th) and one frost (2.0 C) on the 18th.
RAINFALL
Average rainfalls around urban Geelong only received 30 mm, whereas the latest 30-year average was 40.1 mm. This has been the driest month of this year, creating a total of 320 mm compared to the 30-year figure of 182 mm.
Even during the tornado on the 20th the rainfall maximum over most of Geelong only received about 10 mm.
OTHER FEATURES
An official tornado on the evening of the 20th lasted from about 1.10 am to 1.40 am as it crossed Mt Duneed, Waurn Ponds and Armstrong Creek. The extreme damage was mainly to houses, fences, cars and garages with extreme destruction to tiled roofs, smashed windows to about 160 properties.
The Bureau of Meteorology estimated an average 60-metre wide path for a slightly winding 6-7 kilometres across the suburbs for about half an hour caused the damage, awakening about 160 homeowners.
The night photograph above was taken over Lara of the tornado during the lightning thunderstorm clearly showing the clockwise cloud movement where the severe storm was operating.
Further features of the month include 4 days of gusty winds over 60 km/h and one severe storm with thunder, lightning and hail on the 20th.
RAINFALL DATA
| GEELONG REGION |
| Location |
Total for Month (mm) |
Monthly Average (mm) |
| Aireys Inlet |
44.4 |
(55.6) |
| Anakie |
na |
(52.0) |
| Apollo Bay |
142.0 |
(99.2) |
| Bacchus Marsh |
27.0 |
(47.5) |
| Ballarat Aero |
62.8 |
(68.1) |
| Bannockburn |
43.2 |
(46.0) |
| Balliang East |
32.2 |
(64.0) |
| Bellbrae |
na |
(65.1) |
| Bells Beach |
22.8 |
(65.1) |
| Beeac |
48.5 |
(57.2) |
| Beech Forest (Otway Fly) |
190.2 |
(181.3) |
| Benwerrin |
na |
(64.5) |
| Cape Otway |
91.8 |
(91.7) |
| Colac |
99.5 |
(71.9) |
| Curlewis Golf Club |
na |
(n.a.) |
| Drysdale |
40.8 |
(48.0) |
| Dereel |
79.3 |
(59.0) |
| Forrest (West Barwon Dam) |
89.4 |
(92.0) |
| Inverleigh |
30.8 |
(56.6) |
| Hoppers Crossing |
37.6 |
(64.2) |
| Meredith (Darra) |
49.4 |
(60.2) |
| Moriac |
33.4 |
(55.0) |
| Mt Gellibrand |
59.6 |
(na) |
| Mt Mercer |
88.6 |
(na) |
| Mt Sabine |
141.4 |
162.4 |
| Ocean Grove |
38.8 |
(na) |
| Point Lonsdale |
na |
(57.0) |
| Queenscliff |
31.6 |
(58.1) |
| Scotsburn |
na |
(na) |
| Sheoaks |
53.6 |
(na) |
| Shelford |
na |
(37.0) |
| Teesdale |
30.4 |
(44.0) |
| Sutherlands Creek |
na |
(41.0) |
| Winchelsea |
54.6 |
(58.0) |
|
 |
| GEELONG SUBURBS |
| Location |
Total for Month (mm) |
Monthly Average (mm) |
| Armstrong Creek |
37.6 |
(40.5) |
| Avalon |
25.0 |
(40.5) |
| Bell Post Hill |
40.2 |
(40.7) |
| Belmont |
34.0 |
(43.1) |
| Breakwater AWS |
28.8 |
(41.5) |
| Charlemont |
32.1 |
(43.9) |
| Corio |
33.2 |
(41.0) |
| Grovedale |
43.0 |
(45.8) |
| Grovedale South |
42.0 |
(49.8) |
| Hamlyn Heights |
39.7 |
(43.5) |
| Herne Hill |
43.0 |
(40.5) |
| Highton North |
26.1 |
(43.8) |
| Highton South |
26.8 |
(43.8) |
| Lara |
32.6 |
(39.4) |
| Leopold |
40.5 |
(44.4) |
| Leopold East |
na |
(44.4) |
| Manifold Heights |
38.7 |
(44.4) |
| Marshall |
32.8 |
(44.4) |
| Moolap |
23.6 |
(46.0) |
| Queens Park |
35.8 |
(41.0) |
| Whittington |
29.8 |
(41.8) |
| Average across Urban Area |
30.0 |
(42.1) |
|


