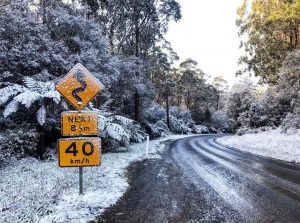
Snow fell in the Otway Ranges on the 4th. Photo from Victorian Weather Chasers.

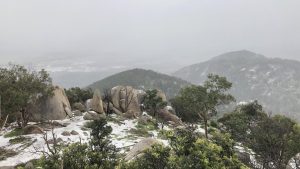
Hail and graupel in the You Yangs on the 4th. Photo Geelong Advertiser.

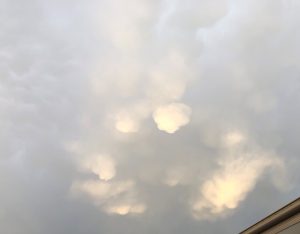
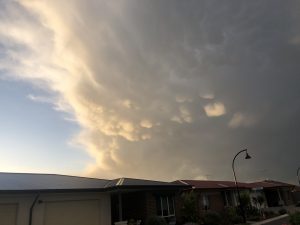
Mammatus Clouds in Northern Geelong sky on 21st at 5.30 pm.

Mammatus Clouds on 21st at 5.30 pm. Photo courtesy Doug Lindsay.
SUMMARY
Geelong was fractionally warmer than the most recent 30-year average temperature and wetter than the average August rainfall.
TEMPERATURE
Geelong’s average daily maximums were 15.3 degrees C and minimums were 6.2 degrees C. These were fractionally warmer than both 15.0 C and 6.0 C which are the latest 30-year averages. The warmest day was recorded 21.2 C on the 29th and the lowest minimums reached 2.7 C on the 11th and 2.8 C on the 4th.
RAINFALL
August was Geelong’s wettest month since May with most of the region exceeding well over average totals. Only a small part of the Otways did not receive above 100% of the August average, but good rains were received by the Geelong urban area, the Bellarine Peninsula as well as the Golden Plains and the Moorabool Valley.
On the wettest day (the 23rd) 19.6 mm fell at Geelong, 42.5 mm at Leopold and 36.2 at Curlewis.
OTHER FEATURES
Snow occurred on the 4th in the Otway Ranges and the Colac district, Ballarat district and light snow or graupel on the You Yangs.
Hail fell in most areas around Geelong on the 4th, as well as the 18th and 23rd.
One thunder day occurred on the 13th but there were no severe storms.
One severe wind gust (80 km/h on 27th)) also 59 km/h at Breakwater on 21st. Many calls were made to SES on the 27th but no casualties were reported.
Rain fell on 21 days in Geelong.
WINTER SUMMARY
Average maximum temperatures: 14.6 degrees C compared to 14.5 C.
Average minimum temps: 5.6 C compared to 6.1 C.
Average Winter Temperature Summary: 0.2 C cooler overall than normal.
RAINFALL DETAILS FOR AUGUST 2020
| GEELONG REGION |
| Location |
Total for Month (mm) |
Monthly Average (mm) |
| Aireys Inlet |
87.0 |
78.5 |
| Anakie (Granite Road) |
53.4 |
46.0 |
| Apollo Bay |
217.2 |
153.0 |
| Bacchus Marsh |
36.0 |
39.0 |
| Barwon Heads |
77.2 |
55.6 |
| Ballarat |
19.8 |
76.4 |
| Bannockburn |
60.2 |
47.0 |
| Bells Beach |
57.0 |
60.4 |
| Beeac |
55.2 |
70.1 |
| Beech Forest (Fly) |
262.0 |
210.0 |
| Benwerrin |
174.0 |
164.0 |
| Boonah |
105.0 |
150.0 |
| Cape Otway |
105.8 |
102.1 |
| Colac |
114.5 |
99.6 |
| Curlewis |
87.3 |
42.0 |
| Dereel |
66.0 |
62.0 |
| Drysdale |
62.4 |
54.9 |
| Forrest (West Barwon) |
175.4 |
150.3 |
| Inverleigh |
63.2 |
na |
| Lal Lal |
84.0 |
49.7 |
| Laverton |
69.0 |
48.0 |
| Melbourne (City) |
60.6 |
51.0 |
| Meredith (Darra) |
70.4 |
61.7 |
| Moriac |
na |
58.0 |
| Mt Cowley |
253.0 |
156.4 |
| Mt Gellibrand |
68.0 |
na |
| Mt Mercer |
86.6 |
70.3 |
| Mt Sabine |
169.0 |
163.7 |
| Ocean Grove |
73.8 |
45.0 |
| Portarlington |
97.8 |
59.0 |
| Queenscliff |
50.4 |
61.4 |
| Scotsburn |
91.4 |
80.3 |
| Shelford |
59.8 |
51.0 |
| Sheoaks |
49.6 |
47.0 |
| Sutherlands Ck |
47.8 |
46.0 |
| Winchelsea |
44.0 |
56.0 |
| Wensleydale |
84.0 |
57.2 |
| Wooloomanata |
48.0 |
47.2 |
|
| GEELONG SUBURBS |
| Location |
Total for Month (mm) |
Monthly Average (mm) |
| Armstrong Creek |
81.5 |
48.3 |
| Avalon |
44.0 |
48.3 |
| Bell Post Hill |
56.2 |
50.9 |
| Belmont |
61.0 |
49.4 |
| Breakwater |
60.6 |
46.9 |
| Charlemont |
47.2 |
44.3 |
| Corio |
41.2 |
42.0 |
| Grovedale |
59.2 |
51.5 |
| Grovedale South |
61.5 |
51.5 |
| Hamlyn Heights |
57.5 |
46.0 |
| Herne Hill |
na |
46.0 |
| Highton |
77.2 |
51.5 |
| Lara |
70.6 |
39.6 |
| Leopold |
98.0 |
49.5 |
| Leopold North |
90.0 |
49.5 |
| Manifold Heights |
66.9 |
46.0 |
| Moolap |
51.8 |
45.0 |
| Marshall |
60.6 |
45.4 |
| Whittington |
57.2 |
51.0 |
| Urban Area Average |
64.0 |
46.0 |
|


