A wild storm cast heavy rocks on the Great Ocean Road near Port Fairy on the 11th. Photo courtesy Scott Gray.

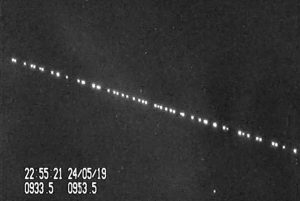
Global Wi-Fi Project reveals unusual light pattern above the Geelong sky on the 12th. Photo courtesy Bay FM.
SUMMARY
Generally a slightly warmer than normal and a much drier month characterised April this year.
TEMPERATURE
Three consecutive days (1st to 3rd) exceeded 30 degrees C with the maximum recording 34.5 C on the 3rd of April. A 3 consecutive days’ run of over 30 C in April has happened just 3 times in Geelong’s history since 1903:
- 1922 (15th to 17th April) averaged 33.6 C.
- 1985 (11th to 13th April) averaged 32.9 C.
- 2021 (1st to 3rd April) averaged 31.6 C.
All up this year there were four days over 30 degrees and it was this factor that mainly resulted in Geelong’s above average temperature. Daily minimums averaged 10.4 C for the month (long term average is 9.9 degrees) and maximums averaged 20.5 C (compared to 20.5 degrees). Consequently the daily mean was 15.5 C, compared to the monthly mean of 15.2 C.
RAINFALL
Geelong’s urban area averaged 18 mm compared to the most recent 30-year average of 41.1 mm. Rainfall occurred on eleven days and the wettest day was only 6.0 mm on the 12th. Obviously El Nino had ended last month and no outlooks show any improvements next month although an early release suggests some good rain next week.
OTHER FEATURES
Geelong’s water catchments show 66 % of capacity.
Strong wind days with gusts over 60 km/h totalled three. The windiest period was from the 10th to the 15th and the maximum gust reached 63 km/h on the 14th. Avalon’s windiest day reached 74 km/h on the 14th.
On the morning of the fourth the minimum temperature was not recorded by the Bureau of Meteorology and Geelong Weather Services had to patch the figure of 11.3 C to provide a complete record.


