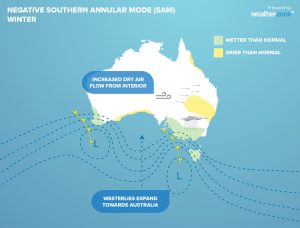
SAM Winter – Negative. The SAM is simply an index that is used to monitor the position of a belt of westerly winds that flow from west to east between Australia and Antarctica.
When the SAM is in a negative phase, these westerly winds, and the cold fronts and low pressure systems they carry, are located further north than usual for that time of year.
When the SAM is positive, the westerly winds, cold fronts and low pressure systems are located further south than usual.
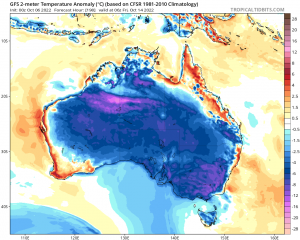
October 22. Prediction for below average temperatures on Oct 14. Courtesy Weatherzone.
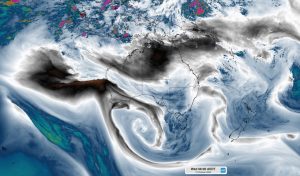
Oct 22 Satellite Image, 12-10-22 courtesy Weatherzone.
The Himawari-8 satellite has captured images of a massive cloud band extending 5,000 kilometres from the Tropical Indian Ocean all the way to southeastern Australia.
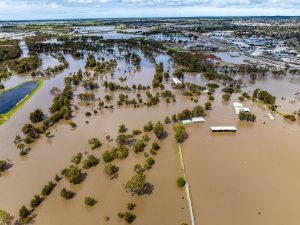
Floods in Barwon River Geelong 16th October. Photo courtesy Bay FM.
It’s expected to remain above the moderate flood level into Sunday afternoon and reached a peak level of 3.86 metres around 12.30pm Saturday.
The peak level was the highest the river has reached in 20 years.
The South Barwon Cricket Club, the river’s rowing clubs as well as Landy athletics field have been inundated, forcing the cancellation of a number of weekend sport competitions.
Many calls for SES workers occurred during the rainfall and floods.
“The estimated country-wide damage bill of more than $5 billion and counting, according to the Insurance Council of Australia.”
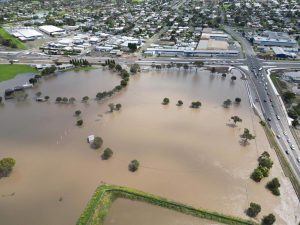
Cricket Grounds under water on 15th October. Photo internet.
SUMMARY
Rainfall was much greater than the 30-year average and minimum and maximum temperatures were fractionally warmer than the 30-year average, see below for details.
TEMPERATURE
Minimum temperatures: Coldest night 3.8 degrees on the 2nd and 10th; coldest day 13.9 degrees on the 5th.
Maximum temperatures: Warmest day 25.6 degrees on the 21st; warmest night 15.8 degrees on the 22nd.
Overall for the month maximum temperatures averaged 18.4 C (30-year average 19.4 C) and minimum temperatures averaged 9.7 C (30-year average 8.5 C), fractionally warmer by 0.1 C.
RAINFALL
Several incredible rainfall events took place in Geelong and most of Victoria in October. On several dates (6-8th 30 mm; 13-14th 50 mm; 22nd 46 mm) persistent rainfall took place which caused both flash flooding and Barwon River flooding as shown in the photos above.
Geelong’s total rainfalls extended from 210 mm to 115 mm as shown below. The total for the 24 hours of the 22nd was the heaviest in the urban area for the year – 46.0 mm. Geelong’s Breakwater rainfall totalled 148.4 mm which was Geelong’s second highest rainfall ever recorded since 1879. The previous record was made in 1949. The whole urban area average was 155 mm.
OTHER FEATURES
Five days (14th, 24th, 27th, 28th and 31st), strong wind gusts at Avalon of between 61 km/h and 76 km/h, happened but only 65 km/h at Breakwater on the 28th was recorded this month.
Two occasions of strong lightning / thunder were experienced over Geelong on the evening of storms on the 21st and the 25th.
RAINFALL DATA
![]()
| GEELONG SUBURBS | ||
 Location Location |
Total for Month (mm) |
|
| Armstrong Creek | 182.0 | 55.9 |
| Avalon | 148.4 | 40.9 |
| Bell Park | 174.0 | 55.9 |
| Belmont | 175.0 | 57.0 |
| Breakwater Racecourse | 148.2 | 49.0 |
| Charlemont | 182.0 | 57.5 |
| Corio | 150.0 | 54.0 |
| Grovedale | 116.0 | 52.8 |
| Grovedale South | 143.0 | 56.3 |
| Herne Hill | 176.0 | 50.6 |
| Highton | 180.0 | 56.1 |
| Lara | 160.4 | 46.0 |
| Leopold | 153.0 | 64.0 |
| Leopold East | 140.0 | 64.0 |
| Manifold Heights | 171.9 | 50.8 |
| Marshall | 163.6 | 50.8 |
| Moolap | 119.4 | 57.0 |
| Queens Park | 170.0 | 51.0 |
| Waurn Ponds | 171.3 | 50.0 |
| Whittington | 158.8 | 53.5 |
| Urban Geelong Average | 155.0 | 51.9 |
