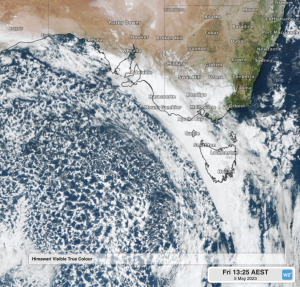
Cold Front crosses S-E Australia. Image courtesy of Weatherzone. By meteorological definition, a front is the transition zone between two air masses of different densities. As differences in density are most often caused by temperatures differences, it follows that a front separates air masses of different temperatures.
SUMMARY
The month lowest temperature was only averaging 8.6 degrees despite the 30-year average of 8.2 C in May, and the maximum highest temperature was 16.5 degrees compared to the 30-year average of 17.2 C, thus ending up with a total of 0.2 degrees cooler than the average temperature overall. Geelong’s total rainfall was 40.0 mm and this qualifies as a total average of 42.3 mm, which Geelong averages for June in total.
TEMPERATURE
The maximum temperature was 22.2 degrees on the 15th; the coolest day was 13.1 degrees on the 7th; the minimum temperature was 4.3 degrees on the 1st and the highest overnight temperature reached 14.1 on the 31st.
RAINFALL
The Geelong total rainfall was approximately 40.0 mm in May, with about eleven suburbs below that figure and with about the same figure above that number. More details can be seen below.
OTHER FEATURES
There have been several fogs during the month but only one day when the maximum wind gust exceeded 60 km/h on the third. This was unusual for an autumn month.
SUMMARY OF AUTUMN 2023
Hottest max temp: 37.2°C on 8th March.
Coldest min temp: 3.9°C on 30th April.
Wettest Day: 23.6mm on 16th April.
Windiest Day: 65 km/h gust at Breakwater on 18th March, uncharacteristic at Geelong for autumn.
Overall statement: Autumn was characterised by warmer than average temperatures and wetter than average rainfall, mainly due to more rain in April.
RAINFALL DATA MAY 2023
|
|
|||||||||||||||||||||||||||||||||||||||||||||||||||||||||||||||||||||||||||||||||||||||||||||||||||||||||||||||||||||||||||||||||||||||||||||||||||||||||||||||||||||||||
