 SUMMARY
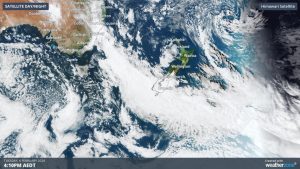
Geelong’s summary climate was cooler than average and partially warmer than the 30-year average.
TEMPERATURE
There were seven days exceeding 30 degrees C in Geelong leading to a maximum average of 40.1 degrees for the month and a minimum of 7.6 degrees for February, compared to the 30-year average of 25.2 C and 14.4 C respectively.
The hottest day reached 40.1 C on the 13th and 22nd, and a minimum of 7.6 C on the 15th.
RAINFALL
Geelong’s rainfall was 0.6 mm for the month. Most of the region had very low totals for February.
OTHER FEATURES
The strongest wind gust was 80 km/h on the 13nd and 22nd at and only two storms were recorded.
SUMMARY OF SUMMER IN GEELONG
Hottest max temp: 40.1° C on 13/2 and 22/2.
Coldest min temp: 7.6° C on 15/2.
Wettest Day: 23.4 mm on 8/1/.
Windiest Day:80 km/h on 13/2/.
Overall statement: Summer was similar to the 30-year seasonal average by about 0.2° C and wetter than average by around 20 mm.
RAINFALL DATA
| GEELONG REGION |
| Location |
Total for Month (mm) |
Monthly Average (mm) |
| Aireys Inlet |
7.6 |
38.9 |
| Anakie |
4.6 |
44.0 |
| Anglesea |
1.2 |
50.3 |
| Bacchus Marsh |
na |
42.8 |
| Ballan |
na |
48.7 |
| Ballarat |
0.8 |
44.7 |
| Bellbrae |
na |
30.4 |
| Benwerrin |
3.0 |
37.6 |
| Beech Forest (Fly) |
7.0 |
64.0 |
| Boonah |
3.6 |
40.0 |
| Cape Otway |
0.8 |
41.8 |
| Colac |
0.5 |
43.8 |
| Cressy |
na |
35.6 |
| Durdidwarrah |
na |
48.5 |
| Dereel |
na |
48.3 |
| Inverleigh |
0.8 |
42.9 |
| Laverton |
6.2 |
49.0 |
| Mt Gellibrand |
0.6 |
49.8 |
| Melton |
na |
na |
| Melbourne (City) |
6.2 |
48.0 |
| Meredith (Darra) |
3.0 |
47.2 |
| Moriac |
na |
35.0 |
| Mt Cowley |
3.2 |
49.6 |
| Mt Mercer |
0.0 |
43.8 |
| Mt Sabine |
7.4 |
48.8 |
| Ocean Grove |
0.7 |
32.0 |
| Pollocksford |
na |
34.0 |
| Pt Lonsdale |
1.6 |
38.1 |
| Shelford |
na |
34.0 |
| Sheoaks |
0.6 |
34.0 |
| Skipton |
na |
34.0 |
| St Leonards |
0.0 |
40.0 |
| Sutherlands Creek |
0.8 |
44.0 |
| Wooloomanata |
0.2 |
37.5 |
| West Barwon Dam |
na |
52.3 |
| Werribee |
4.0 |
34.5 |
|
 |
| GEELONG SUBURBS |
| Location |
Total for Month (mm) |
Monthly Average (mm) |
| Armstrong Creek |
0.5 |
37.3 |
| Avalon |
1.8 |
37.3 |
| Belmont (1) |
0.7 |
35.8 |
| Belmont (2) |
0.0 |
39.0 |
| Breakwater AWS |
0.4 |
31.0 |
| Charlemont |
na |
39.8 |
| Corio |
1.0 |
36.0 |
| Grovedale |
0.8 |
36.3 |
| Grovedale South |
0.9 |
39.1 |
| Hamlyn Heights |
na |
38.2 |
| Herne Hill |
na |
34.0 |
| Highton |
0.8 |
39.0 |
| Lara |
21.3 |
37.6 |
| Leopold East |
2.0 |
40.7 |
| Lovely Banks |
2.7 |
40.0 |
| Manifold Heights |
na |
37.4 |
| Marshall |
0.8 |
36.3 |
| Moolap |
0.6 |
38.8 |
| North Shore |
na |
36.0 |
| Queens Park |
na |
31.0 |
| Whittington |
0.4 |
36.1 |
| Urban Area Average |
2.0 |
35.7 |
|
 SUMMARY