SUMMARY
Geelong was hotter than the 30-year average by 0.8 degrees C and much drier than the average rainfall (8 mm compared to 38.7 mm).
TEMPERATURE
Temperatures for the region were higher than average, and two significant new records of 3 December days over 40 degrees and a new top temperature for the month of 45.1 C was set on the 20th. Despite all this no overall monthly average figures reached anywhere close to the records. There were four days over 30 C; maximums averaged 24.6 C and minimums averaged 12.4 C, a mean of 18.5 C, well below the highest figures which averaged 20.1 C in 2015.
RAINFALL
Very low rainfalls were recorded right across the region, within the lowest decile since 1871. The urban area averaged just 8 mm, just short of January (4 mm), the driest month of 2019. In fact the rainfall map of the whole state shows well below average across all of Victoria.
OTHER FEATURES
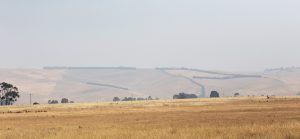
There were 4 days of extreme wind gusts over 60 km/h, with maximums of 70 km/h on the 3rd and 78 km/h on the 30th. Two other days reached speeds of 59 km/h at Breakwater. On two days Total Fire Ban days were declared with several short-lived bushfires burning at Mt Mercer and some closer districts. Two thunder-days occurred during a couple of brief storms yielding only 2.6 millimeters on the 30th and 31st. A smoke haze day (see photo above) around Geelong was most noticeable on Christmas Day.
RAINFALL DATA
| GEELONG REGION | ||
| Location | Total for Month (mm) | Monthly Average (mm) |
| Aireys Inlet | na | 34.0 |
| Anakie | 5.4 | 55.0 |
| Anglesea | 12.0 | 48.0 |
| Apollo Bay | na | 63.2 |
| Bacchus Marsh | 8.6 | 47.1 |
| Ballan | 9.2 | 45.9 |
| Ballarat | 5.4 | 51.6 |
| Bannockburn | 10.2 | 42.0 |
| Barwon Heads Golf Club | 5.0 | 47.0 |
| Bells Beach | 15.8 | 54.0 |
| Beeac | na | 42.4 |
| Beech Forest (Fly) | 104.0 | 96.4 |
| Benwerrin | na | n.a. |
| Boonah | 31.0 | n.a. |
| Cape Otway | 29.2 | 52.7 |
| Colac | 25.2 | 46.6 |
| Curlewis Golf Club | 6.8 | 44.2 |
| Dereel | 13.6 | 44.2 |
| Drysdale | 14.6 | 44.7 |
| Gerangamete | na | n.a. |
| Inverleigh | 15.4 | 45.5 |
| Lal Lal | 9.0 | n.a. |
| Laverton | 6.2 | 45.0 |
| Lethbridge | 6.0 | 55.9 |
| Melbourne (City) | 6.2 | 59.0 |
| Melton | 7.0 | 44.0 |
| Meredith (Darra) | 4.8 | 51.8 |
| Moriac | 13.5 | n.a. |
| Mt Buninyong | na | n.a. |
| Mt Cowley | na | 85.0 |
| Mt Gellibrand | 18.2 | na |
| Mt Mercer | 14.8 | n.a. |
| Mt Sabine | na | 90.0 |
| Point Lonsdale | 8.8 | 45.0 |
| Ocean Grove | 14.2 | 45.5 |
| Queenscliff | 4.8 | 43.4 |
| Shelford | na | 45.0 |
| Sheoaks | 2.6 | 29.2 |
| Skipton | 8.6 | 46.4 |
| St Leonards | 11.6 | 45.0 |
| Sutherland’s Creek | 9.4 | na |
| Wallington | 10.6 | n.a. |
| West Barwon Dam | na | 65.0 |
| Wensleydale | 26.0 | 41.1 |
| Wooloomanata | 2.4 | n.a. |
| GEELONG SUBURBS | ||
| Location | Total for Month (mm) | Monthly Average (mm) |
| Armstrong Creek | 13.8 | 28.1 |
| Avalon | 7.0 | 28.1 |
| Batesford | 9.2 | 44.0 |
| Bell Post Hill | 7.9 | 47.8 |
| Belmont | 5.0 | 44.0 |
| Breakwater Racecourse | 8.6 | 41.0 |
| Charlemont | na | 44.2 |
| Corio | 7.0 | 42.0 |
| Grovedale | 8.0 | 44.2 |
| Grovedale South | 11.2 | 44.2 |
| Hamlyn Heights | 10.7 | 42.0 |
| Herne Hill | 12.0 | 42.0 |
| Highton | 8.8 | 44.2 |
| Highton West | 12.0 | 44.0 |
| Lara | 6.4 | 42.0 |
| Leopold | 10.5 | 53.9 |
| Leopold North | 11.0 | 42.0 |
| Manifold Heights | 12.6 | 47.8 |
| Moolap | 7.8 | 38.0 |
| Moolap Salt Works | 8.8 | 42.2 |
| North Shore | 8.0 | 44.0 |
| Waurn Ponds | na | 42.2 |
| Whittington | 7.6 | 42.0 |
| Urban Area Average | 8.0 | 41.9 |

