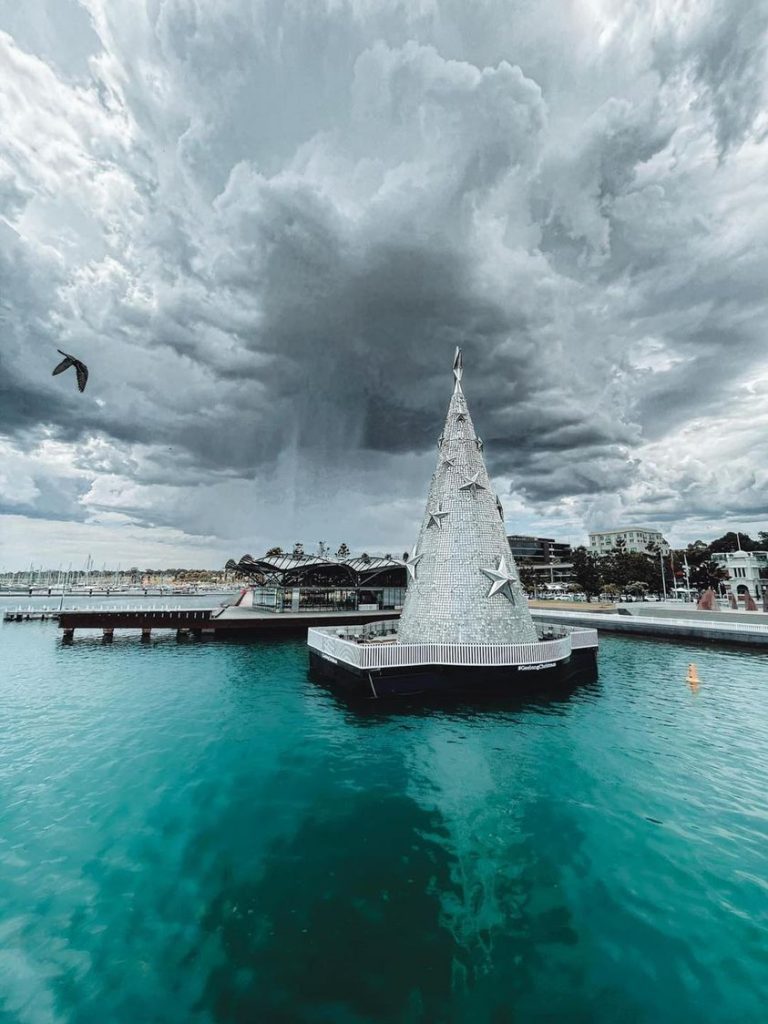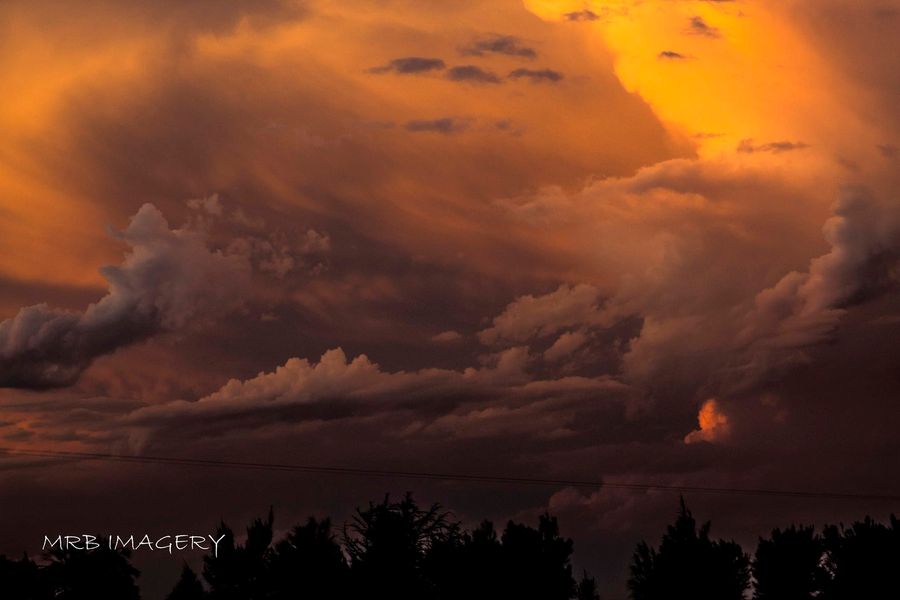

Photo above: Sunset cloud over Geelong on 2nd December. Very little rain. Courtesy Mal Arnott.

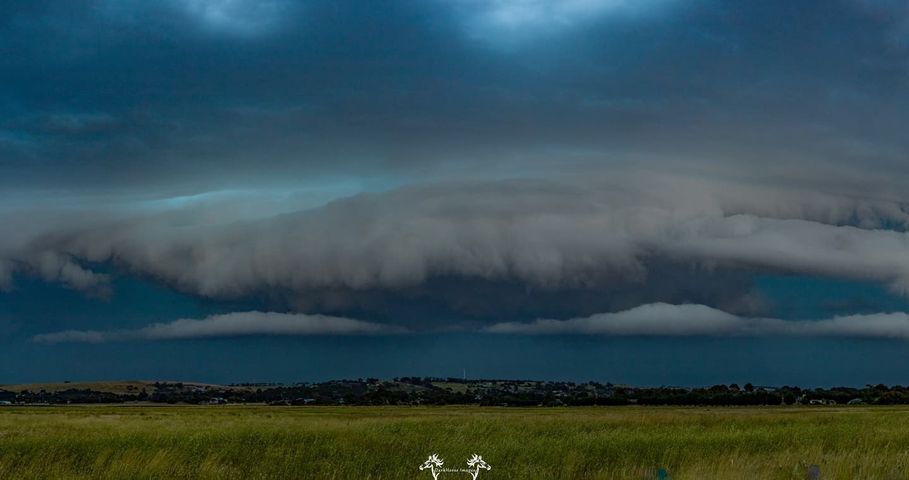
Cloud north of Lara on 2nd December. Photo courtesy internet.
SUMMARY
Geelong was about 5 mm below the average 37.6 mm rainfall, around 0.1 C less than the average 23.6 C and 11.8 C maximum and minimum 30-year temperatures. See the details below.
TEMPERATURE
Daily maximum temperatures averaged 23.5C and daily minimum temperatures averaged 11.8 C during December. These figures combined led to a mean temperature of 17.65 C which was cooler than the 30-year average of 17.7 C.
Maximum temperatures were 39.4 C on the 31st, 33.5 C on the 13th and the 18th, 33.3 C on the 1st. On the coldest day, the 7th, the maximum only reached 15.9 C.
Minimum temperature was 7.4 C on the 8th. The warmest night’s figure was 15.7 C on the 18th.
RAINFALL
Urban Geelong averaged 32 mm on just 7 days. On the wettest day, the 9th, 20.4 mm was recorded.
Despite the Bureau’s prediction of a wetter than average December, the month’s total for Geelong Breakwater AWS was only 31.4 mm. Most of the whole region from the Otway Ranges to the Bellarine Peninsula received below average rainfall.
OTHER FEATURES
There were 4 days of thunder – lightning which only led to a few mm on the 1st, 2nd, 7th and the 19th and some brief hail storms on the 1st and 2nd at Lara and the Bellarine Peninsula. No severe storms occurred.
There were 2 days which exceeded 60 km/h wind gusts, with the maximum of 80 km/h on the 19th. On that day Avalon Airport recorded a 91 km/h gust. There were at least another two days on which gusts of 56 km/h occurred but these days do not qualify as extreme gusts.
RAINFALL DATA
| GEELONG REGION | ||
| Location | Total Rainfall for Month (mm) | Monthly Average (mm) |
| Aireys Inlet | 21.0 | 34.0 |
| Anakie | 36.8 | 55.0 |
| Anglesea | 21.8 | 48.0 |
| Apollo Bay | 17.4 | 63.2 |
| Bacchus Marsh | 27.4 | 47.1 |
| Ballan | 62.2 | 45.9 |
| Ballarat Aerodrome | 26.4 | 51.6 |
| Bannockburn | 36.2 | 42.0 |
| Barwon Heads Golf Club | 30.8 | 47.0 |
| Bells Beach | 18.5 | 54.0 |
| Beeac | 22.0 | 42.4 |
| Beech Forest (Fly) | 34.2 | 96.4 |
| Benwerrin | 46.2 | n.a. |
| Boonah | 45.2 | n.a. |
| Cape Otway | 4.8 | 52.7 |
| Colac | 11.0 | 46.6 |
| Curlewis | 35.9 | 44.2 |
| Dereel | 37.0 | 44.2 |
| Drysdale | 46.8 | 44.7 |
| Forrest (West Barwon) | 25.0 | 53.2 |
| Inverleigh | 23.4 | 45.5 |
| Lal Lal | 45.2 | n.a. |
| Laverton | 40.6 | 45.0 |
| Lorne | 47.2 | na |
| Melbourne (City) | 26.8 | 59.0 |
| Meredith (Darra) | 55.6 | 51.8 |
| Moriac | na | n.a. |
| Mt Buninyong | 46.6 | n.a. |
| Mt Cowley | 49.4 | 85.0 |
| Mt Gellibrand | 5.0 | na |
| Mt Mercer | 55.8 | n.a. |
| Mt Sabine | 57.4 | 90.0 |
| Point Lonsdale | 22.2 | 45.0 |
| Ocean Grove | 30.0 | 45.5 |
| Queenscliff | 24.9 | 43.4 |
| Shelford | 19.0 | 45.0 |
| Sheoaks | 20.4 | 29.2 |
| Skipton | 18.4 | 46.4 |
| St Leonards | 29.1 | 45.0 |
| Sutherland’s Creek | 40.8 | na |
| Torquay | 25.6 | n.a. |
| Winchelsea | na | 45.0 |
| Wensleydale | na | 41.1 |
| Wooloomanata | 37.2 | n.a. |
| GEELONG SUBURBS | ||
| Location | Total Rainfall for Month (mm) | Monthly Average (mm) |
| Armstrong Creek | 65.4 | 28.1 |
| Avalon | 25.4 | 28.1 |
| Batesford | 37.8 | 44.0 |
| Bell Post Hill | 29.2 | 47.8 |
| Belmont | 34.0 | 44.0 |
| Breakwater Racecourse AWS | 31.4 | 39.0 |
| Charlemont | 48.8 | 44.2 |
| Corio | 39.5 | 42.0 |
| Grovedale | 25.4 | 44.2 |
| Grovedale South | 21.0 | 44.2 |
| Hamlyn Heights | 30.6 | 42.0 |
| Herne Hill | 37.0 | 42.0 |
| Highton | 37.0 | 44.2 |
| Highton West | 25.4 | 44.0 |
| Lara | 32.6 | 42.0 |
| Leopold | 38.6 | 53.9 |
| Leopold East | 35.7 | 42.0 |
| Manifold Heights | 31.5 | 40.8 |
| Moolap | 29.8 | 38.0 |
| Moolap Salt Works | 29.6 | 42.2 |
| North Shore | 36.4 | 44.0 |
| Waurn Ponds | 29.6 | 42.2 |
| Whittington | 31.8 | 42.0 |
| Urban Area Average | 32.0 | 40.0 |
