TEMPERATURE
February 2017 turned out to be just fractionally cooler than average. Maximums averaged 25.8 degrees (30-year average is 25.2 C) and minumums averaged 13.5 C for the month (30-year average is 14.2 C).
The top temperature reached 36.3 C on the 8th and there were 8 days over 30 deg. On the coldest night (the 15th) the mercury fell to 8.3 C.
RAINFALL
A constant downpour on the 5th (recorded at 9 am on the 6th) of 40.6 mm gave central Geelong more than the month’s average rainfall. Outer suburbs, such as Grovedale, received less than this (27 mm) but the result was similar: some flash flooding, thunder and lightning, but the event did not qualify as a severe storm.
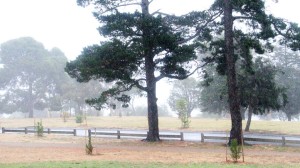
There were only 5 rain days, but most of the region received above average falls. Water catchments are at 70% of capacity. PHOTO: Harry de Wit.

OTHER FEATURES
Apart from the heavy rain on the 5th the month featured very little of interest – no strong winds, no extreme temperatures or storms.
SUMMER SUMMARY
Overall Geelong’s summer was warmer than the 30-year mean temperature; 19.5 C compared with 18.9 C. Summer was also drier ( 91 mm compared to 118 mm). Only February was wetter than normal.
RAINFALL DATA
| GEELONG REGION |
 Location Location |
Total for Month (mm) |
Monthly Average (mm) |
| Aireys Inlet |
29.6 |
38.9 |
| Anakie West |
38.3 |
44.0 |
| Apollo Bay |
51.8 |
50.3 |
| Bacchus Marsh |
29.4 |
42.8 |
| Ballan |
na |
48.7 |
| Ballarat |
43.6 |
44.7 |
| Bannockburn |
35.0 |
35.0 |
| Barwon Heads Golf Club |
54.8 |
41.0 |
| Bells Beach |
28.2 |
30.4 |
| Bellbrae |
na |
30.4 |
| Beeac |
na |
37.6 |
| Beech Forest |
70.0 |
64.0 |
| Birregurra |
na |
36.3 |
| Boonah |
41.6 |
40.0 |
| Cape Otway |
34.4 |
41.8 |
| Colac |
19.8 |
43.8 |
| Clifton Springs |
40.8 |
39.4 |
| Cressy |
15.2 |
35.6 |
| Curlewis |
na |
37.4 |
| Drysdale |
na |
37.4 |
| Durdidwarrah |
46.8 |
48.3 |
| Gellibrand |
na |
46.0 |
| Gerangamete |
na |
47.2 |
| Inverleigh |
37.6 |
42.9 |
| Johanna Heights |
63.0 |
80.0 |
| Laverton |
34.6 |
49.0 |
| Lavers Hill |
na |
85.0 |
| Lal Lal |
36.4 |
49.8 |
| Melton |
38.4 |
na |
| Melbourne (City) |
40.0 |
48.0 |
| Meredith (Darra) |
35.6 |
47.2 |
| Moriac |
na |
35.0 |
| Morrisons |
na |
45.8 |
| Mt Cowley |
36.8 |
49.6 |
| Mt Mercer |
25.2 |
43.8 |
| Mt Sabine |
21.8 |
48.8 |
| Ocean Grove |
na |
32.0 |
| Pollocksford |
34.6 |
34.0 |
| Pt Lonsdale |
65.3 |
38.1 |
| Scotsburn |
33.0 |
34.0 |
| Shelford |
na |
34.0 |
| Sheoaks |
26.2 |
34.0 |
| Skipton |
na |
34.0 |
| St Leonards |
48.0 |
40.0 |
| Sutherlands Creek |
32.0 |
44.0 |
| Torquay |
na |
44.0 |
| Warncoort |
na |
34.0 |
| Wooloomanata |
35.6 |
37.5 |
| West Barwon Dam |
na |
55.0 |
| Werribee |
37.4 |
34.5 |
| You Yangs |
na |
32.0 |
|
 |
| GEELONG SUBURBS |
 Location Location |
Total for Month (mm) |
Monthly Average (mm) |
| Avalon |
29.0 |
37.3 |
| Bell Post Hill |
37.7 |
35.8 |
| Belmont |
27.0 |
39.0 |
| Breakwater |
46.2 |
31.0 |
| Connewarre |
na |
39.8 |
| Corio |
33.2 |
36.0 |
| East Geelong |
na |
37.4 |
| Grovedale |
na |
36.3 |
| Grovedale South |
37.0 |
39.1 |
| Hamlyn Heights |
36.0 |
38.2 |
| Herne Hill |
47.0 |
34.0 |
| Highton |
na |
39.0 |
| Lara |
27.8 |
37.6 |
| Lara (Serendip) |
na |
37.6 |
| Leopold East |
na |
40.7 |
| Leopold |
49.0 |
40.7 |
| Manifold Heights |
41.8 |
37.4 |
| Moolap |
44.6 |
38.8 |
| North Geelong |
na |
36.0 |
| Queens Park |
na |
31.0 |
| Waurn Ponds |
36.8 |
32.0 |
| Whittington |
32.8 |
36.1 |
| Urban Area Average |
40.0 |
36.0 |
|


