
A few visual highlights …
Geelong’s Weather Highlights for 2018
PLEASE ACKNOWLEDGE GEELONG WEATHER SERVICES.
:
Key Points – Below average rainfall, warmer than average.
- Mean annual temp = 15.5°C. (0.8° above average).
- Driest month was February (5 mm).
- Total annual rainfall was 423 mm. (Long term average = 518 mm).
- Hottest day: 41.7° on 6th Jan.
Warmest night: 25.1° on 29th Jan.
Coldest day: 8.9° on 28th June.
Coldest night: 0.2° deg on 2nd July.
- Wettest month: June: 57.8 mm.
- Number of days above 30° C: 27 (average is 21).
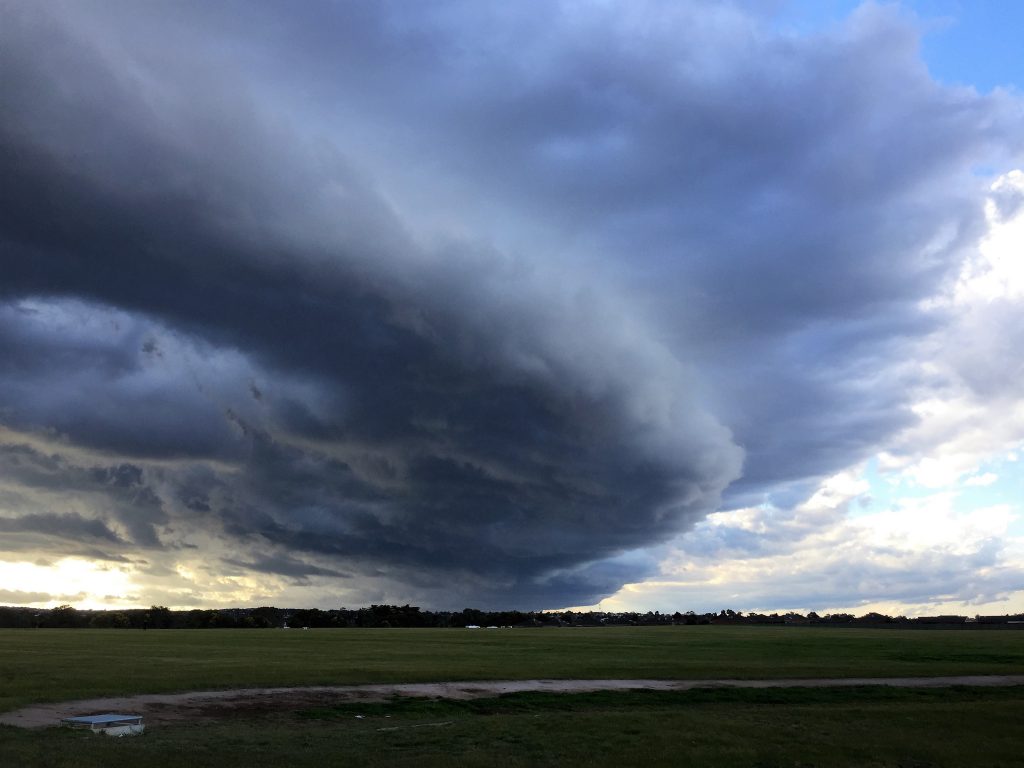
- Number of Thunder Days: 21 (average is 15).
- Number of severe storms: 2 (average is 3).
- Strongest wind gust: 122 km/h at Point Wilson on 17th July.
- Number of windy days where gusts exceeded 60kph: 28. (20 in 2017)
- Windiest month: July (6 days with gusts >60 km/h).
- Calmest months: January and October (0 gusts >60 kph).
- Other interesting features:
- Barwon Water catchments fluctuated between 49% and 66% during the year.
- 10 frosts (when air temps <2 degrees C). Average is 15.
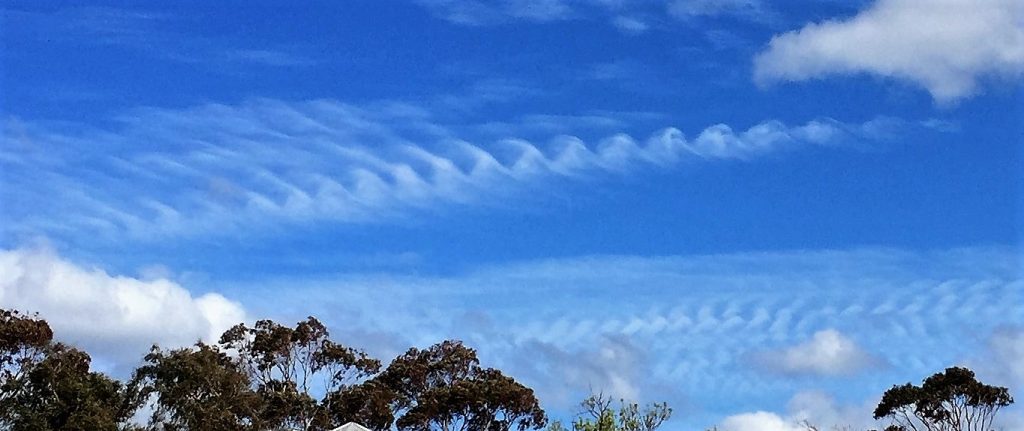
- Kelvin-Helmholtz cirrus clouds photographed on Sept 17.
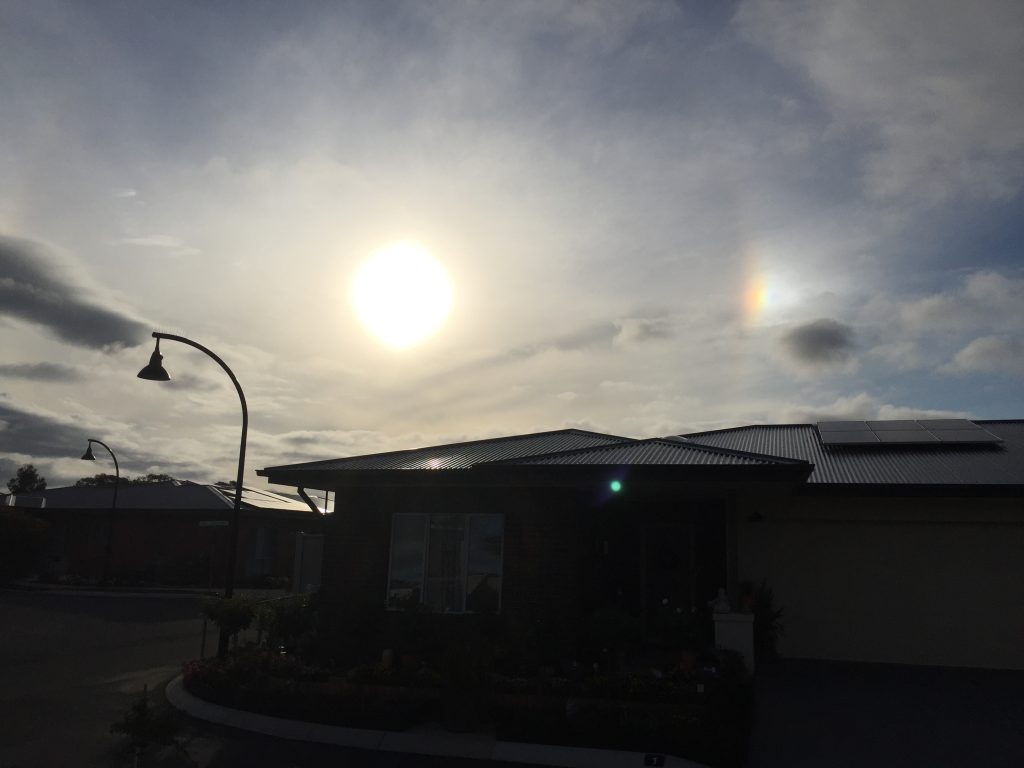
- Twin sundogs photographed on Dec 17.
* All temperature and rainfall figures derived from sources at Breakwater AWS, Bureau of Meteorology and GWS.
© Geelong Weather Services, 2018 �