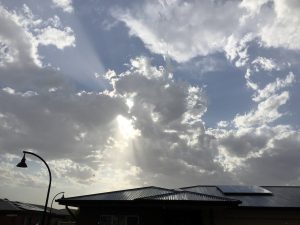
A little rain falls during a weak thunderstorm, Jan 30th. (Photo L. Smail)
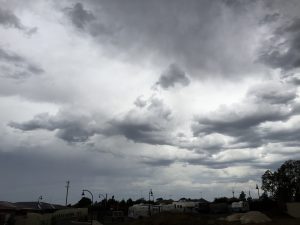
Remnant of thunderstorm leaves Geelong. Jan 30th. (Photo L. Smail)
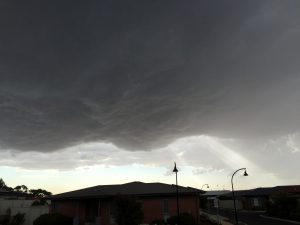
Bottom of cumulonimbus cloud, Jan 30th. Photo L. Smail
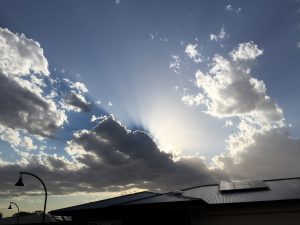
An weak iridescent sky effect is produced by sun shining behind thunderstorm cloud. Photo L. Smail
TEMPERATURE
Geelong was very hot in January; the sixth hottest since records began in 1902. Mean temperature (average daily maximums plus minimums all divided by 2) was 21.7 degrees. In 1908 the highest mean was 23.8 and this was followed by 22.2 in 1981, 22.0 in 1961 and 21.8 in both 1959 and 1974.
The top temperature reached 44.3 on the 4th followed by 43.9 on the 25th. All up there were nine days over 30. Only on one occasion did the mercury drop below 10 C overnight; the lowest minimum of 8.9 occurred on the morning of the 10th.
RAINFALL
Very poor rainfall, the lowest since 2009, was experienced during the month. Lowest in the urban area was 1.6 mm at North Shore and highest was 10.0 mm at Armstrong Creek. A number of stations did not report in and one can only assume that very little or no rain at all fell at those places.
Meanwhile the Barwon Water catchments are down to 48% of capacity, having lost 6.4% over the dry month.
OTHER FEATURES
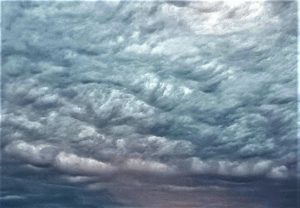
Asperitas clouds seen over Geelong. Photo courtesy Jacob Grams. This rough-surfaced feature of altostratus type occurred on the 16th and was noticed by Jacob as he returned to his car around 8 pm. Originally called Undulatus Asperatus the cloud name was recently changed to Asperitas. It usually means some air turbulence and upper wind shear, but little rainfall.
The only other weather feature were two thunder days – on the 18th and 30th – when only a few millimetres fell haphazardly across the district.
RAINFALL DATA
| GEELONG REGION |
| Location |
Total for
Month
(mm) |
Monthly
Average
(mm) |
| Aireys Inlet |
2.4 |
32.0 |
| Anakie |
1.6 |
40.0 |
| Anglesea |
1.4 |
36.0 |
| Apollo Bay |
4.0 |
52.1 |
| Bacchus Marsh |
5.2 |
33.0 |
| Ballan |
3.6 |
34.9 |
| Ballarat |
4.0 |
39.1 |
| Bannockburn |
4.0 |
30.0 |
| Barwon Heads Golf Club |
na |
33.0 |
| Beech Forest Fly |
8.8 |
75.2 |
| Beeac |
na |
27.9 |
| Benwerrin |
1.4 |
43.9 |
| Bellbrae |
na |
51.1 |
| Birregurra |
na |
27.9 |
| Boonah |
1.8 |
n.a. |
| Cape Otway |
3.6 |
43.9 |
| Clifton Springs |
na |
43.9 |
| Colac |
1.2 |
43.9 |
| Cressy |
na |
43.9 |
| Curlewis Golf Club |
2.4 |
33.8 |
| Dereel |
2.7 |
43.0 |
| Drysdale |
na |
41.4 |
| Durdidwarrah |
2.4 |
43.7 |
| Inverleigh |
2.4 |
36.0 |
| Lal Lal |
1.8 |
n.a. |
| Laverton |
29.8 |
40.0 |
| Lethbridge |
2.0 |
38.0 |
| Melbourne (City) |
11.2 |
48.0 |
| Meredith (Darra) |
2.6 |
40.9 |
| Moriac |
1.0 |
43.9 |
| Mt Buninyong |
1.2 |
n.a. |
| Mt Cowley |
2.6 |
n.a. |
| Mt Gellibrand |
3.6 |
30.0 |
| Mt Mercer |
na |
n.a. |
| Mt Sabine |
3.4 |
n.a. |
| Ocean Grove |
5.2 |
n.a. |
| Pollocksford |
na |
36.0 |
| Point Lonsdale |
3.2 |
36.0 |
| Queenscliff |
2.8 |
35.0 |
| Shelford |
na |
33.0 |
| Sheoaks |
1.6 |
n.a. |
| Sutherlands Creek |
1.2 |
n.a. |
| St Leonards |
na |
35.0 |
| Shelford |
1.8 |
n.a. |
| Torquay |
na |
29.0 |
| Wallington |
5.0 |
n.a. |
| West Barwon Dam |
3.2 |
52.5 |
| Wensleydale |
3.2 |
25.4 |
| Wooloomanata |
2.0 |
n.a. |
|
 |
| GEELONG SUBURBS |
| Location |
Total for
Month
(mm) |
Monthly
Average
(mm) |
| Armstrong Creek |
10.0 |
37.0 |
| Avalon |
3.2 |
37.1 |
| Bell Post Hill |
1.6 |
34.8 |
| Belmont |
4.0 |
34.8 |
| Breakwater |
2.0 |
39.4 |
| Charlemont |
na |
38.5 |
| Corio |
1.4 |
na |
| Grovedale |
8.0 |
na |
| Grovedale South |
7.5 |
na |
| Hamlyn Heights |
2.8 |
na |
| Herne Hill |
3.0 |
34.8 |
| Highton |
4.6 |
na |
| Lara |
1.8 |
na |
| Leopold |
2.0 |
47.6 |
| Leopold East |
3.7 |
47.6 |
| Leopold North |
na |
48.0 |
| Manifold Heights |
3.1 |
na |
| Marshall |
4.0 |
38.1 |
| Moolap |
2.2 |
42.0 |
| North Shore (Midway) |
1.6 |
37.0 |
| North Shore (IPL) |
2.4 |
37.0 |
| Queens Park |
2.4 |
n.a. |
| Waurn Ponds |
3.8 |
38.1 |
| Whittington |
2.4 |
38.2 |
| Urban Area Average |
4.0 |
39.4 |
|


