Mottled sky over Geelong on the 5th after a smoky haze all day.

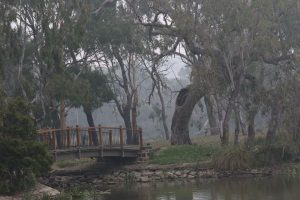
Smoky day at Balyang Sanctuary on the 6th. Photo Harry de Wit.

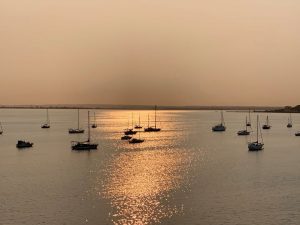
Copper sky and Corio Bay on the 13th. Photo 93.9 Radio.
SUMMARY
Geelong and most of the region experienced well above average rain and slightly higher temperatures than the latest 30-year averages. A severe storm occurred at Avalon on the 15th. Most of the first half of the month was hazy and smoky from the Gippsland fires.
TEMPERATURE
Daily maximums averaged 26.1 degrees C (compared to 25.4 C) and daily minimums averaged 13.9 degrees C (compared to 13.9 C). This resulted in a monthly mean of 20.0 C, about 0.4 C above the 30-year average. There were six days over 30 degrees including two days over 40 degrees. Maximum temperature for the month was 43.4 C on the 31st.
OTHER FEATURES
Around 15 days in the first 23 days were overcast, hazy, smoggy or smoky due to westerly drifting winds over Geelong from the disastrous fires in Gippsland.
Those days were punctuated by a severe storm on the 15th in the northern suburbs and the Peninsula. Thunder, lightning and hail occurred over most of Geelong but heavy rain (44 mm in less than an hour) and strong wind gusts caused damage at Avalon, Portarlington, St Leonards and Drysdale.
RAINFALL
Much of the immediate region, Geelong and the Bellarine Peninsula, totalled double or more of the monthly averages as seen in the table below. Much of this rain fell not only in the severe storm mentioned above, but also on the 22nd when Geelong amassed 34.6 mm till 9 am on the 23rd, but this was slow and steady rain which was perfect for gardens and runoff.
On the 22nd and 23rd northerly wind gusts reached 70 km/h and 65 km/h respectively but these did not qualify as a severe storm since there was minimal damage.
RAINFALL DATA
| GEELONG REGION |
| Location |
Total for
Month
(mm) |
Monthly
Average
(mm) |
| Aireys Inlet |
59.0 |
32.0 |
| Anakie |
63.8 |
40.0 |
| Anglesea |
50.2 |
36.0 |
| Apollo Bay |
37.4 |
52.1 |
| Bacchus Marsh |
51.4 |
33.0 |
| Ballan |
85.0 |
34.9 |
| Ballarat |
70.0 |
39.1 |
| Bannockburn |
49.8 |
30.0 |
| Barwon Heads Golf Club |
58.0 |
33.0 |
| Beech Forest Fly |
52.4 |
75.2 |
| Beeac |
31.5 |
27.9 |
| Bellbrae |
48.3 |
51.1 |
| Boonah |
57.6 |
n.a. |
| Cape Otway |
43.6 |
43.9 |
| Colac |
28.9 |
43.9 |
| Curlewis Golf Club |
53.4 |
33.8 |
| Dereel |
88.1 |
43.0 |
| Drysdale |
115.4 |
41.4 |
| Indented Head |
92.5 |
50.0 |
| Inverleigh |
47.0 |
36.0 |
| Laverton |
87.0 |
40.0 |
| Melbourne (City) |
115.2 |
48.0 |
| Meredith (Darra) |
50.0 |
40.9 |
| Moriac |
51.0 |
43.9 |
| Mt Buninyong |
93.7 |
n.a. |
| Mt Gellibrand |
27.8 |
30.0 |
| Mt Mercer |
58.6 |
n.a. |
| Mt Sabine |
na |
n.a. |
| Ocean Grove |
90.8 |
n.a. |
| Pollocksford |
40.2 |
36.0 |
| Point Lonsdale |
68.7 |
36.0 |
| Queenscliff |
81.6 |
35.0 |
| Shelford |
na |
33.0 |
| Sheoaks |
49.4 |
n.a. |
| Sutherlands Creek |
43.4 |
n.a. |
| St Leonards |
127.6 |
35.0 |
| Shelford |
na |
n.a. |
| Torquay |
58.8 |
29.0 |
| Wallington |
na |
n.a. |
| West Barwon Dam |
na |
52.5 |
| Wensleydale |
52.4 |
25.4 |
| Winchelsea |
44.2 |
35.4 |
| Wooloomanata |
48.2 |
n.a. |
|
 |
| GEELONG SUBURBS |
| Location |
Total for
Month
(mm) |
Monthly
Average
(mm) |
| Armstrong Creek |
48.6 |
37.0 |
| Avalon |
88.4 |
37.1 |
| Bell Post Hill |
61.8 |
34.8 |
| Belmont |
na |
34.8 |
| Breakwater |
74.0 |
39.4 |
| Charlemont |
78.0 |
38.5 |
| Corio |
50.8 |
na |
| Grovedale |
56.0 |
na |
| Grovedale South |
50.5 |
na |
| Hamlyn Heights |
na |
na |
| Herne Hill |
73.0 |
34.8 |
| Highton |
55.0 |
na |
| Lara |
76.6 |
na |
| Leopold |
89.5 |
47.6 |
| Leopold East |
na |
47.6 |
| Leopold North |
94.0 |
48.0 |
| Manifold Heights |
69.9 |
na |
| Marshall |
60.0 |
38.1 |
| Moolap |
72.4 |
42.0 |
| North Shore (Midway) |
59.2 |
37.0 |
| North Shore (IPL) |
60.4 |
37.0 |
| Queens Park |
63.6 |
n.a. |
| Waurn Ponds |
44.2 |
38.1 |
| Whittington |
64.8 |
38.2 |
| Urban Area Average |
75.0 |
39.4 |
|


