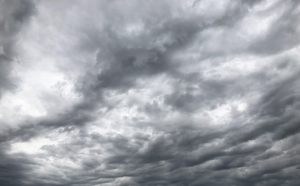
JAN 2nd 21st. Sky cover on several days over Belmont show distant clouds which failed to reach Geelong after poor forecasting at the time by the Bureau of Meteorology. Photo L. Smail.
SUMMARY
A wetter than average January was recorded across most of southwestern Victoria and Geelong was well included, receiving 90 mm (latest 30-year average is 38.1 mm).
Daily Temperatures averaged 0.6 degrees below the average figure of 19.3 degrees C.
TEMPERATURE
In Geelong the average maximum was 24.1C compared to the 30-year average of 25.4 C and the average minimum was 14.0 C compared to the average of 13.9 C.
There were 3 days over 30 C and these included 3 days over 35 degrees; on the hottest day 37.1 degrees was reached on the 11th. Lowest maximum day was the 19th with a total of 18.9 C.
Minimum overnight temperature was 10 degrees on the 15th and the highest minimum reached 19.7 C on the 25th.
RAINFALL
Geelong’s wetter than normal figures resulted in 90 mm compared to the latest 30-year figure of 38.1 mm. On the wettest days 20.2 mm on the 29th, 19 mm on the 3rd and 19.8 mm on the 30th were recorded at Breakwater racecourse and average rain across the urban area totalled closer to 90 mm overall.
Nine days of rainfall occurred in January.
OTHER FEATURES
There were several windy days, but only day exceeded 60 km/h; on the 27th maximum gusts of 65 km/h were recorded at Breakwater Racecourse.
There was one day of small hail on the 16th and two thunder – lightning days on the 2nd and the 29th.
Total water catchments for Geelong reached 76% of the total available but this is expected to grow further during February.
RAINFALL DATA
|
|
|||||||||||||||||||||||||||||||||||||||||||||||||||||||||||||||||||||||||||||||||||||||||||||||||||||||||||||||||||||||||||||||||||||||||||||||||||||||||||||||||||||||||||||||||||||||||||||||||||||||||||||||||||
