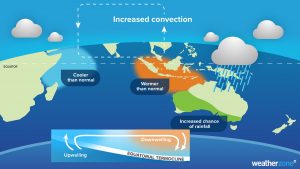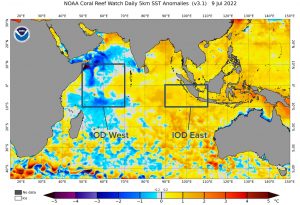
Negative IOD Information current rainfall. Map Weatherzone.
SUMMARY
Geelong had a cooler July than average and a wetter month on average. See details below.

July 22 IOD temps. Copy from Weatherzone. The Indian Ocean Dipole index has just reached its most negative value since 2016, increasing the likelihood of wet weather over southeastern Australia in the coming months.
The Indian Ocean Dipole (IOD) is an index that measures the difference in sea surface temperatures on either side of the tropical Indian Ocean. This index is negative when water is abnormally cool on the western side of the Indian Ocean and unusually warm on the eastern side.
TEMPERATURE
Geelong had 6 days below 2 degrees overnight, the 6th, 10th, 20th, 21st, 22nd and 30th and the lowest temperature was -0.4 C on the 21st and 30th. The average maximum was 13.6 C and the average minimum was 5.1 C. The 30-year’s averages were 14.1 C and 5.8 C. Overall the mean temperature this July was 9.4 C. The warmest day (24th) reached 17.4 C.
RAINFALL
Unseasonal rain and record-smashing cold is wiping out Queensland’s fruit and vegetable crops.
Prices have soared for fresh produce like lettuce and strawberries in recent weeks; now the cost of other fruits and vegetables are set to follow suit after inclement conditions have torn through the state’s key growing regions, reports freshplaza.com. There has been widespread rain across parts of the state in what the Bureau of Meteorology describes as abnormal conditions for this time of year.
Most of the Otway Ranges received below average rain, but Geelong’s urban area and Bellarine Peninsula rainfall averaged above 50 mm this month. The wettest day brought 11.6 mm on the 24th. There were 21 rain days and most of the rain fell in patchy drizzle throughout the days and nights.
OTHER FEATURES
There were several days of strong wind gusts over 60 km/h near Geelong. The strongest gusts on the 17th included Avalon 80 km/h, Mt Gellibrand 83 km/h, Queenscliff 69 km/h, Queens Park 69 km/h, Sheoaks 74 km/h, Portarlington 66 km/h and Geelong 67 km/h, while Geelong on the 16th had gusts up to 59 km/h. At Aireys Inlet there were gusts up to 72 km/h on the 17th and the 8th.
Frosts occurred on 6 days within minimum temperatures of 2 degrees C or lower. Fogs also occurred on most of those days.
RAINFALL DATA
| GEELONG REGION | ||
| Location | Total for Month (mm) |
Monthly Average (mm) |
| Aireys Inlet | 11.4 | 75.7 |
| Anakie West | 15.4 | na |
| Apollo Bay | 66.0 | 128.3 |
| Bacchus Marsh | 16.8 | 34.3 |
| Ballan | 59.3 | 47.3 |
| Ballarat Aerodrome | 44.2 | 68.0 |
| Bannockburn | na | 43.0 |
| Beech Forest (Otway Fly) | 164.2 | 201.2 |
| Bellbrae | 63.3 | 63.7 |
| Bells Beach | na | 63.7 |
| Beeac | 44.6 | 63.2 |
| Benwerrin | 102.4 | 120.8 |
| Boonah | 76.2 | 92.1 |
| Breamlea | 51.2 | na |
| Cape Otway | 83.0 | 105.8 |
| Colac | 83.0 | na |
| Colac (Mt Gellibrand) | 53.6 | 58.9 |
| Drysdale | 117.0 | 49.0 |
| Dereel | 69.6 | 52.0 |
| Forrest (West Barwon Dam) | na | 131.3 |
| Inverleigh | 42.0 | 52.8 |
| Lal Lal | 44.0 | 70.0 |
| Laverton | 38.0 | 42.0 |
| Lorne | 76.4 | 115.1 |
| Melbourne (City) | 36.2 | 49.0 |
| Mt Mercer | 39.0 | 39.0 |
| Meredith (Darra) | 32.0 | 49.0 |
| Moriac | na | 57.0 |
| Mt Cowley | 132.2 | 148.0 |
| Mt Mercer | 39.0 | na |
| Mt Sabine | 178.4 | 189.4 |
| Ocean Grove | 58.4 | 59.0 |
| Point Lonsdale | 49.6 | 56.0 |
| Queenscliff | 61.0 | 56.6 |
| Scotsburn (Mt Buninyong) | 53.8 | 56.6 |
| Shelford | 29.6 | 45.0 |
| Sheoaks | 28.0 | 45.0 |
| St Leonards | 85.4 | 55.0 |
| Sutherlands Creek | 28.2 | na |
| Winchelsea | 42.0 | 45.0 |
| GEELONG SUBURBS | ||
| Location | Total for Month (mm) |
Monthly Average (mm) |
| Armstrong Creek | 49.2 | 41.4 |
| Bell Post Hill | na | 47.2 |
| Belmont | 48.5 | 43.5 |
| Breakwater Racecourse | 48.8 | 43.5 |
| Corio | 36.0 | 40.0 |
| Grovedale | 51.6 | 44.2 |
| Grovedale South | 59.8 | 47.5 |
| Hamlyn Heights | 37.6 | 44.0 |
| Herne Hill | 36.0 | 45.0 |
| Highton | 48.0 | 43.5 |
| Lara | 32.0 | 38.6 |
| Leopold North | 65.5 | 47.4 |
| Leopold East | 69.3 | 47.4 |
| Marshall | 57.4 | 43.5 |
| Moolap | 45.8 | 43.0 |
| Waurn Ponds | 54.4 | 43.0 |
| Whittington | 52.8 | 49.5 |
| Wooloomanata | 26.4 | 38.6 |
| URBAN AREA AVERAGE | 50.0 | 43.5 |
