RAINFALL
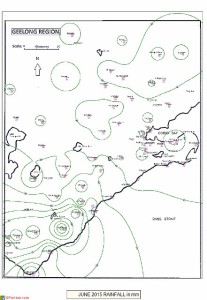
Most of the Geelong-Bellarine-Otways region had below average rainfall in June. Urban Geelong only received around 75% of the latest 30-year average and parts of the Otways were not much better than 50%. The Moorabool system generally recorded less than half the June normal.
Despite the poor result the water supplies are still at 57% of capacity, and the situation will not become critical unless there are only low falls for another couple of months. By September the position will become clearer.
The graphic below shows the rainfall distribution over the region. Click on the map to enlarge it.
TEMPERATURE
Temperatures for Geelong were within 0.1 degree of the latest 30-year average for June. Maximums averaged 14.3 C (mean 14.5) and minimums 6.7 C (mean 6.3).
The warmest day reached 17.9 C on the 8th, and the warmest minimum was 12.4 C on the same day. Most days were partly sunny with the typical cloudy winter conditions but with less rain than expected.
OTHER FEATURES
Only one strong wind gust was recorded (61 kph at Breakwater on the 8th) and there were no storms or other unusual phenomena, although some good aurora australis photos were taken from the district in the early morning of the 27th.
RAINFALL DATA
| GEELONG REGION | ||
| Location | Total for Month (mm) |
Monthly Average (mm) |
| Aireys Inlet | 40.0 | 66.8 |
| Anakie | 30.0 | 49.0 |
| Anglesea | na | 57.0 |
| Apollo Bay | 48.9 | 109.8 |
| Bacchus Marsh | 15.8 | 38.6 |
| Ballan | 42.2 | 45.0 |
| Ballarat | 27.6 | 64.7 |
| Bannockburn | 30.6 | 42.0 |
| Barwon Heads | 38.8 | 57.0 |
| Bellbrae | 33.6 | 60.4 |
| Beeac | 35.9 | 55.9 |
| Beech Forest | 113.6 | na |
| Benwerrin | 97.6 | na |
| Birregurra | 39.4 | 64.8 |
| Boonah | 68.4 | na |
| Cape Otway | 30.2 | 98.0 |
| Colac | 28.4 | 56.8 |
| Clifton Springs | 49.0 | 36.8 |
| Cressy | 29.0 | 45.9 |
| Curlewis | 46.4 | 36.8 |
| Dereel | 24.0 | 65.0 |
| Drysdale | na | 62.5 |
| Durdidwarrah | 28.0 | 57.2 |
| Forrest | na | 113.0 |
| Forrest (West Barwon) | 48.0 | 125.0 |
| Gellibrand | na | 111.8 |
| Inverleigh | 25.5 | 46.7 |
| Johanna Heights | 68.0 | na |
| Lake Colac | na | 76.8 |
| Lal Lal | 15.0 | na |
| Laverton | 27.8 | 38.0 |
| Lorne | 50.0 | 125.2 |
| Melbourne (City) | 27.8 | 50.0 |
| Meredith (Darra) | 30.4 | 57.9 |
| Moriac | 36.5 | 53.0 |
| Morrisons | na | na |
| Mt Buninyong | na | na |
| Mt Cowley | 118.6 | na |
| Mt Gellibrand | 35.2 | na |
| Mt Mercer | 27.2 | na |
| Mt Sabine | 164.8 | na |
| Point Lonsdale | 43.6 | 58.0 |
| Pollocksford | 29.4 | na |
| Portarlington | na | 55.4 |
| Queenscliff | na | 56.6 |
| Shelford | na | 47.0 |
| Sheoaks | 34.0 | na |
| St Leonards | 37.5 | 55.0 |
| Teesdale | na | 50.0 |
| Torquay | na | 52.0 |
| Wurdi Boluc | 54.0 | 55.0 |
| Wyelangta | 115.4 | 213.1 |
| Winchelsea | 37.7 | 48.5 |
| You Yangs | 26.0 | 35.0 |
| GEELONG SUBURBS | ||
| Location | Total for Month (mm) |
Monthly Average (mm) |
| Avalon | 37.8 | 35.6 |
| Bell Park | 27.5 | 40.6 |
| Belmont | 41.0 | 43.9 |
| Connewarre | 41.0 | 48.7 |
| Corio | 33.5 | 40.0 |
| East Geelong | 36.0 | 42.0 |
| Grovedale | 46.0 | 42.2 |
| Grovedale South | 50.0 | 42.2 |
| Hamlyn Heights | 33.0 | 42.0 |
| Herne Hill | 33.0 | 42.0 |
| Highton | 34.0 | 42.1 |
| Lara | 26.4 | 37.3 |
| Lara (Serendip) | na | 37.3 |
| Leopold North | 38.0 | 62.9 |
| Leopold | 43.0 | 62.9 |
| Leopold East | 47.5 | 62.9 |
| Manifold Heights | 34.6 | 41.9 |
| Moolap | 36.0 | 61.0 |
| Racecourse | 32.8 | 41.6 |
| Waurn Ponds | 36.4 | 41.6 |
| Whittington | 31.0 | 41.1 |
| URBAN AREA AVERAGE | 38.0 | 46.1 |

