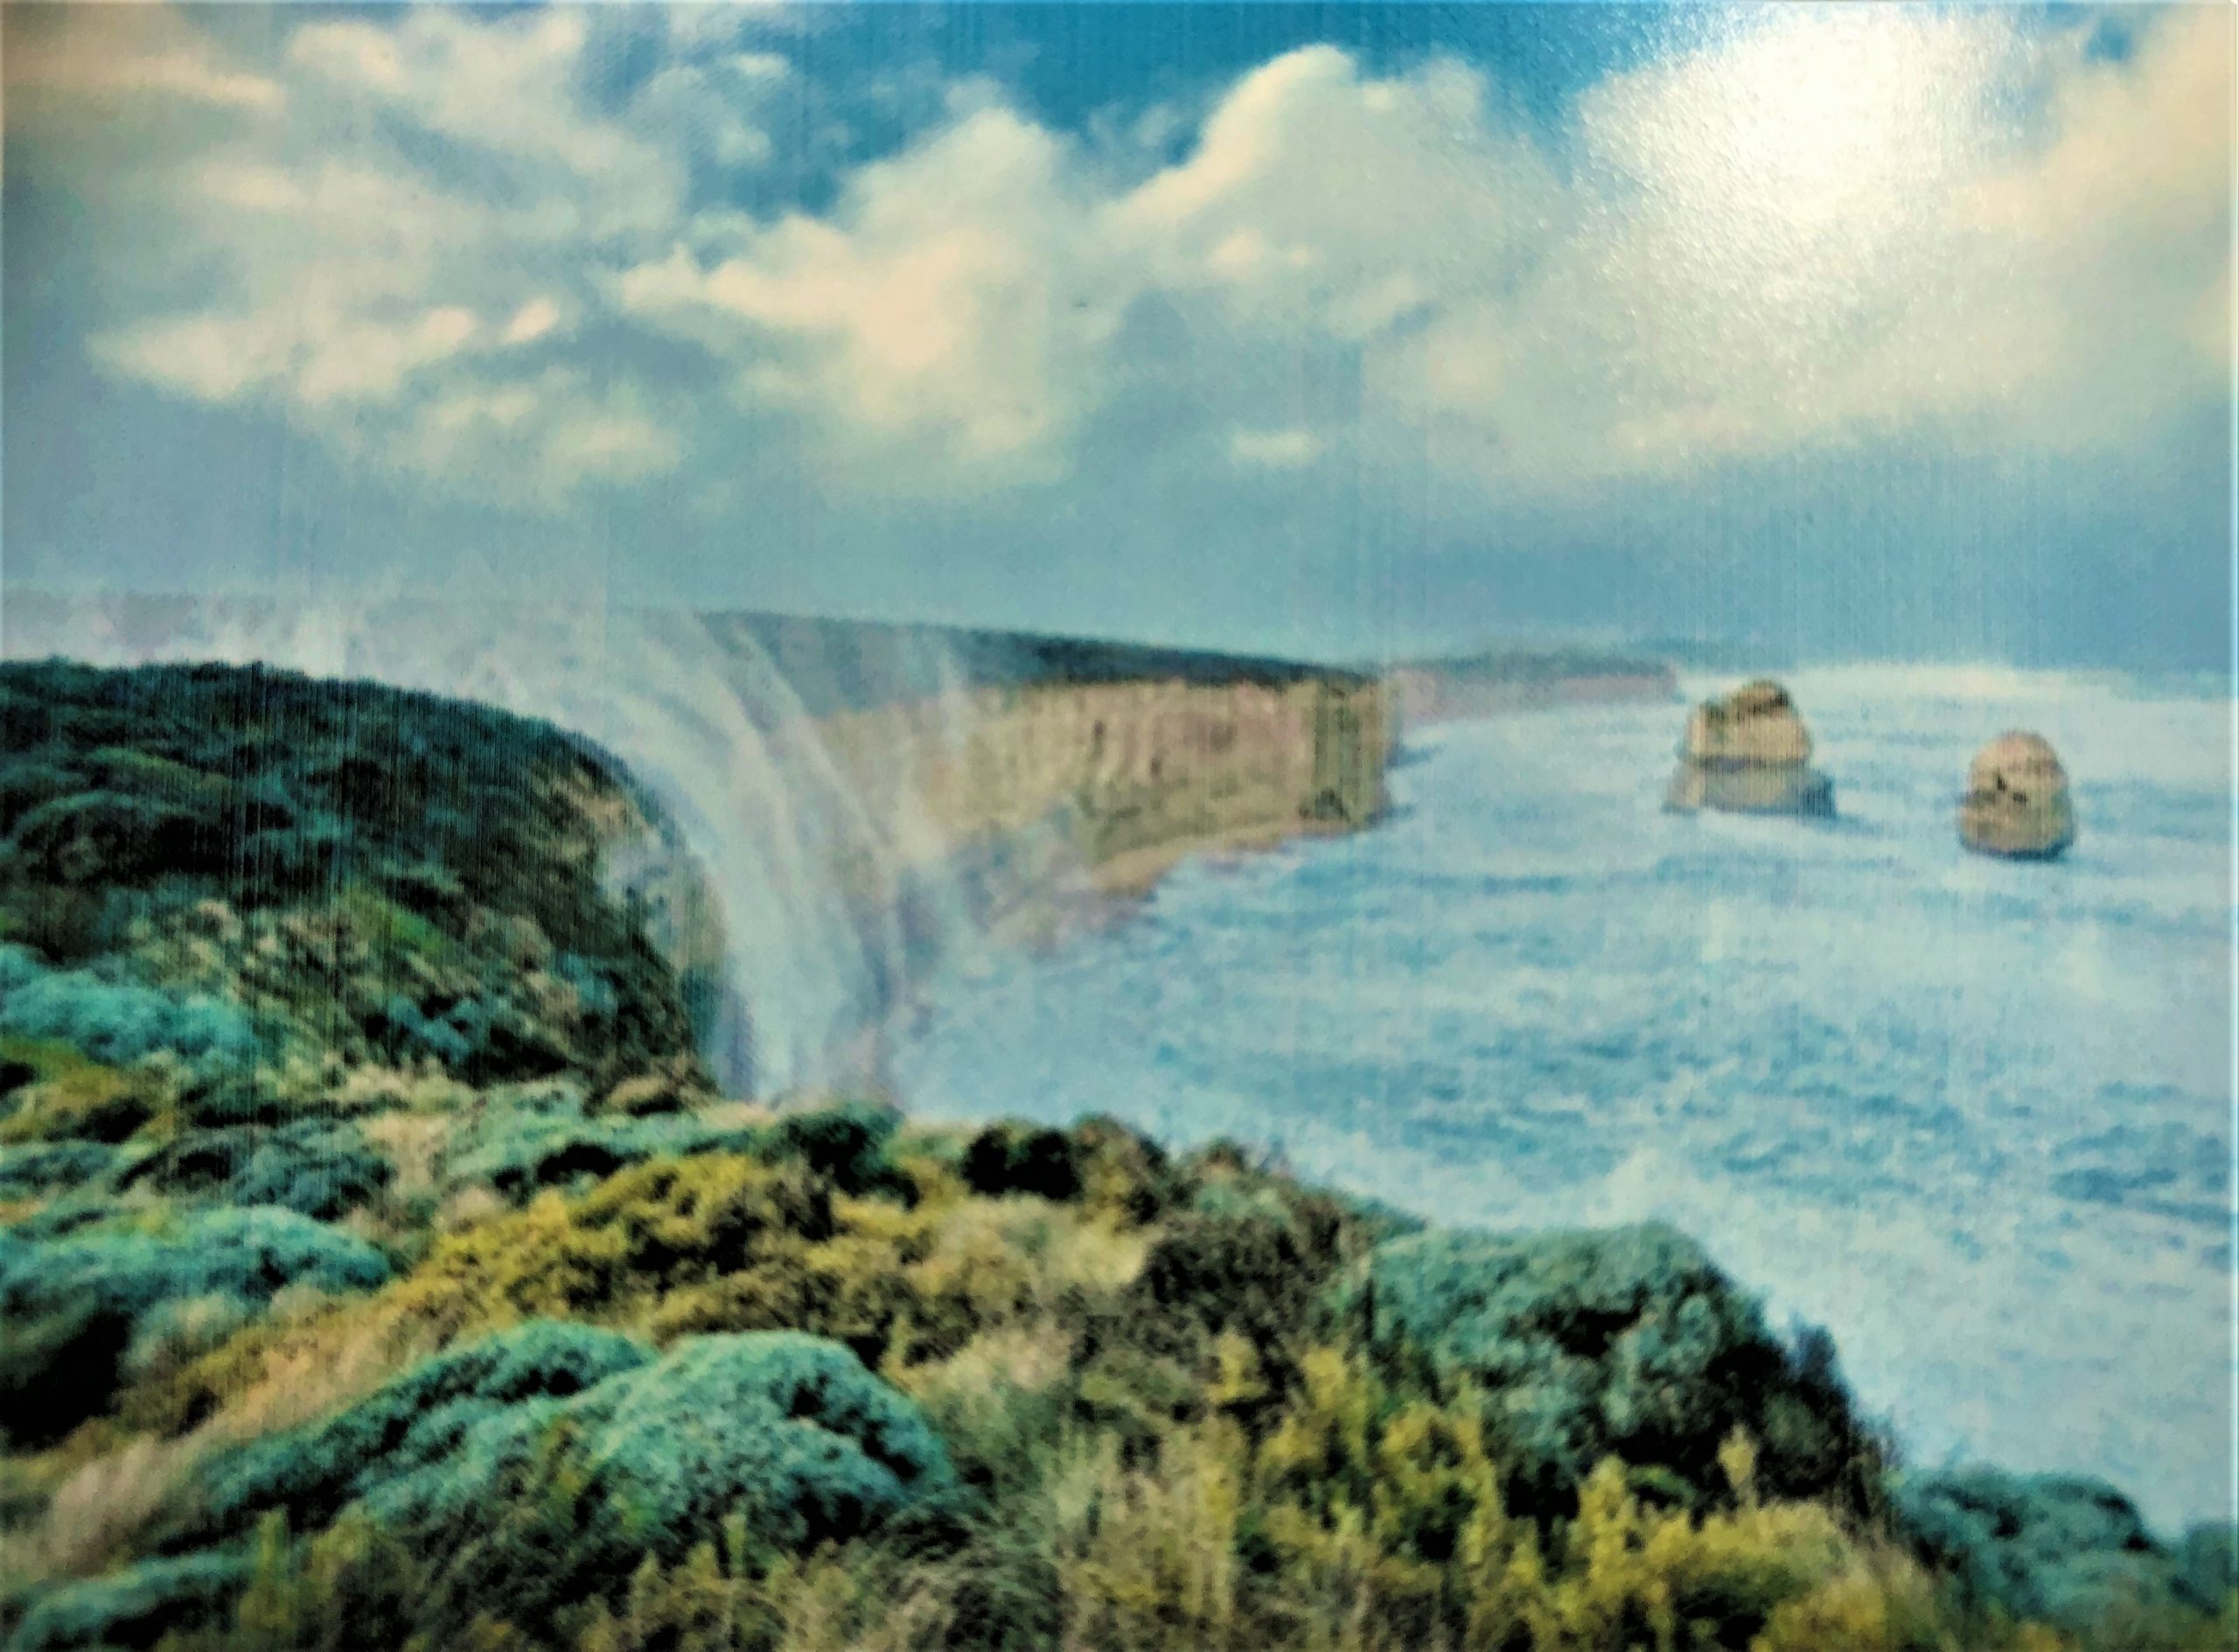
The above photo of wild weather at the Twelve Apostles shows the “upside-down waterfall” which was caused by a lot of heavy rain and strong winds on the 9th and 10th. The complex low pressure system caused this feature which resulted in much tree damage and major flooding in southern Victoria (but not urban Geelong). Photo courtesy @roar_image_photography on Instagram and Weatherzone.
SUMMARY
Fractionally warmer, with above average rainfall in the Geelong region. Warmer by about 0.5 degrees C and average to above average rainfall was recorded.
TEMPERATURE
In Geelong the average daily maximum temperature was 15.2 degrees C and the average daily minimum temperature was 6.6 degrees C. These figures compare with the latest 30-year averages of 14.5 C and 6.4 C respectively, showing a fractionally warmer month of 0.5 degrees C. There were three days of frost (1.9 degrees on the 28th, 1.2 degrees on the 22nd and 0.3 degrees C on the 29th) and four foggy mornings.
RAINFALL
Urban Geelong’s June average rainfall was above the 30-year average of 47.9 mm and the rest of the region exceeded the average. Geelong totalled 48.6 mm for the month. The wettest day recorded 15.2 mm on the 25th and there were 13 rainy days.
OTHER FEATURES
There were two very windy days on the 9th and 10th with the maximum gust of 76 km/h at Breakwater on the 10th. No storms were experienced. The water catchment storages are standing at 77% of capacity.
An earthquake occurred in Bass Strait just off Cape Otway on the 23rd. Its strength was measured at 3.8 on the Richter scale and many reports were heard in places like Colac and even in southern Geelong according to the Geelong Advertiser.
RAINFALL DATA
| GEELONG REGION | ||
| Location | Total for Month (mm) | Monthly Average (mm) |
| Aireys Inlet | 65.8 | 66.8 |
| Anakie | 31.4 | 49.0 |
| Apollo Bay | 116.9 | 109.8 |
| Bacchus Marsh | 44.4 | 38.6 |
| Ballarat | 87.0 | 64.7 |
| Bannockburn | na | 42.0 |
| Beech Forest (Otway Fly) | 194.0 | 199.8 |
| Benwerrin | 122.6 | na |
| Boonah | 102.0 | na |
| Cape Otway | 85.4 | 98.0 |
| Colac | 84.4 | 56.8 |
| Curlewis | 47.8 | 36.8 |
| Dereel | 97.4 | 65.0 |
| Drysdale | 71.2 | 62.5 |
| Forrest (West Barwon Dam) | 138.2 | 125.0 |
| Inverleigh | 64.4 | 46.7 |
| Lal Lal | 83.2 | na |
| Laverton | 31.0 | 38.0 |
| Lorne | 87.6 | 125.2 |
| Melbourne (City) | 43.6 | 50.0 |
| Meredith (Darra) | 67.8 | 57.9 |
| Moriac | na | 53.0 |
| Mt Buninyong | 91.0 | na |
| Mt Cowley | 127.0 | na |
| Mt Gellibrand | 62.0 | na |
| Mt Mercer | 72.4 | na |
| Mt Sabine | 189.0 | na |
| Ocean Grove | 75.4 | na |
| Point Lonsdale | 58.8 | 58.0 |
| Queenscliff | 51.1 | 56.6 |
| Shelford | 67.1 | 47.0 |
| Sheoaks | 52.4 | na |
| St Leonards | 55.2 | 55.0 |
| Sutherlands Creek | 44.2 | 45.0 |
| Wensleydale | 91.4 | 48.5 |
| GEELONG SUBURBS | ||
| Location | Total for Month (mm) | Monthly Average (mm) |
| Armstrong Creek | 51.2 | 35.6 |
| Avalon | 28.6 | 35.6 |
| Bell Post Hill | 57.5 | 40.6 |
| Belmont | 43.5 | 43.9 |
| Breakwater Racecourse | 48.4 | 47.3 |
| Charlemont | 51.2 | 48.7 |
| Corio | 42.8 | 40.0 |
| Grovedale | 56.0 | 42.2 |
| Grovedale South | 53.5 | 42.2 |
| Hamlyn Heights | 49.5 | 42.0 |
| Herne Hill | 45.0 | 42.0 |
| Highton North | 53.5 | 42.1 |
| Highton South | 76.2 | 42.1 |
| Lara | 33.2 | 37.3 |
| Leopold North | 62.9 | 62.9 |
| Leopold | 52.0 | 62.9 |
| Leopold East | 69.0 | 62.9 |
| Marshall | 48.0 | 47.3 |
| Manifold Heights | 51.4 | 41.9 |
| Moolap | 45.0 | 61.0 |
| Waurn Ponds | 70.8 | 47.3 |
| Whittington | 49.6 | 47.3 |
| URBAN AREA AVERAGE | 55.0 | 47.9 |
