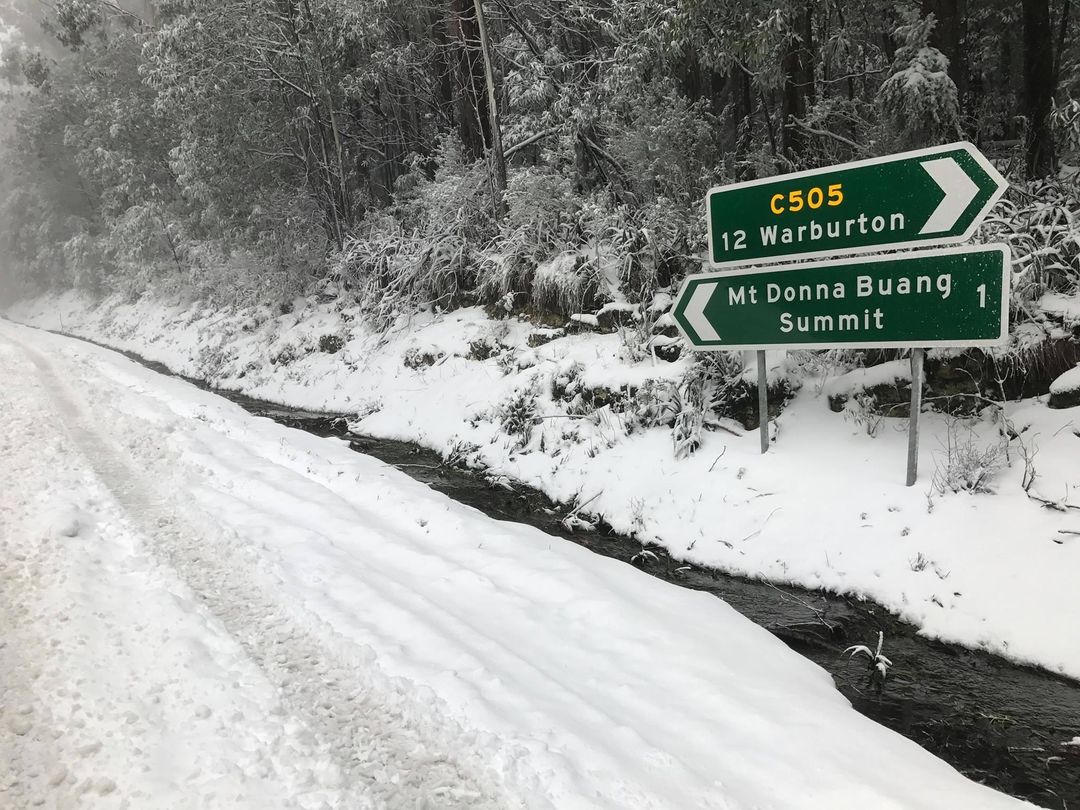
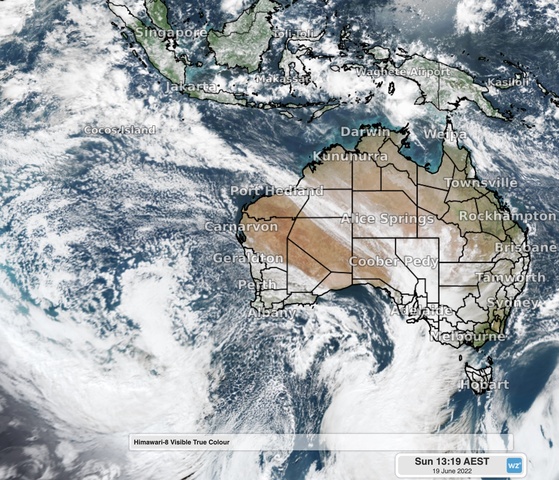
Winter started very cold in Victoria as shown on the internet on June 1st.
SUMMARY

Geelong’s weather for June this year was warmer than normal and average rainfall across the region.
TEMPERATURE
All of Australia’s southeastern and cities as Geelong just had their coldest start to winter in decades amid a two-week procession of cold fronts.
A series of slow-moving long-wave troughs caused a persistent stream of cold air over southeastern Australia during the first two weeks of June. This weather pattern caused a prolonged run of below-average temperatures and cold blustery winds across several states and territories according to Weatherzone.
Geelong’s warmest maximum reached 17.3 C on the 18th and 20th and the coolest minimum was 1.8 C on the 29th, giving a mean monthly temperature of 10.8 C compared to the latest 30-year June average of 10.4 C.

RAINFALL
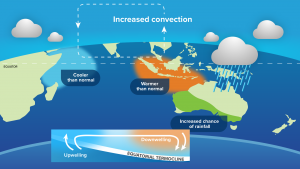
Increased convection, known as the Indian Ocean Dipole, creates more rainfall over southeastern Australia during a negative phase. This climate driver, as well as a La Niña pattern generally, produces more rainfall on the Weatherzone diagram shown.
The outlooks imply that the Pacific Ocean will most likely be in either a weak La Niña pattern, or a La Niña-like pattern, throughout most of 2022. Given we have just seen two La Niñas in two years, this increases the likelihood of the first triple consecutive La Niña event in around two decades.
Since 1950, three consecutive La Niña seasons have occurred one from 1973 to 1976 and the other from 1998 to 2001. However, the current La Niña signal is much stronger than it was at the same point in those two triple-La Niña events, according to Weatherzone.
Geelong’s urban area rainfall was 45.0 mm for the month, with 7.8 mm falling at 9 am on the 1st, and 17 raindays. Geelong’s average rainfall (according the latest 30-year figure) was 46.4 mm.
OTHER FEATURES
The Otways water catchment figures were 83% of maximum total.
There was one day with a maximum wind gust of 63 km/h on the 23rd.
RAINFALL DATA
| GEELONG REGION | ||
| Location | Total for Month (mm) | Monthly Average (mm) |
| Aireys Inlet | 37.4 | 66.8 |
| Anakie | 26.2 | 49.0 |
| Apollo Bay | 95.0 | 109.8 |
| Bacchus Marsh | na | 38.6 |
| Ballarat | 67.4 | 64.7 |
| Bannockburn | na | 42.0 |
| Beech Forest (Otway Fly) | 258.0 | 199.8 |
| Benwerrin | 163.8 | na |
| Boonah | 68.2 | na |
| Cape Otway | 92.4 | 98.0 |
| Colac | 128.0 | 56.8 |
| Curlewis | 55.6 | 36.8 |
| Dereel | na | 65.0 |
| Drysdale | na | 62.5 |
| Forrest (West Barwon Dam) | na | 125.0 |
| Inverleigh | 58.4 | 46.7 |
| Lal Lal | 60.2 | na |
| Laverton | 35.8 | 38.0 |
| Lorne | na | 125.2 |
| Melbourne (City) | 52.4 | 50.0 |
| Meredith (Darra) | 31.0 | 57.9 |
| Moriac | 60.2 | 53.0 |
| Mt Buninyong | 83.4 | na |
| Mt Cowley | 175.0 | na |
| Mt Gellibrand | 69.6 | na |
| Mt Mercer | 70.0 | na |
| Mt Sabine | 224.2 | na |
| Ocean Grove | 74.0 | na |
| Point Lonsdale | 37.3 | 58.0 |
| Queenscliff | 85.0 | 56.6 |
| Shelford | 43.4 | 47.0 |
| Sheoaks | 39.8 | na |
| St Leonards | 50.0 | 55.0 |
| Sutherlands Creek | 31.2 | 45.0 |
| Wensleydale | 80.0 | 48.5 |
| GEELONG SUBURBS | ||
| Location | Total for Month (mm) | Monthly Average (mm) |
| Armstrong Creek | 47.4 | 35.6 |
| Avalon | 33.2 | 35.6 |
| Bell Post Hill | na | 40.6 |
| Belmont | 39.5 | 43.9 |
| Breakwater Racecourse | 37.2 | 46.4 |
| Charlemont | 48.0 | 48.7 |
| Corio | na | 40.0 |
| Grovedale | 48.5 | 42.2 |
| Grovedale South | 50.2 | 42.2 |
| Hamlyn Heights | 41.2 | 42.0 |
| Herne Hill | 54.0 | 42.0 |
| Highton North | 49.5 | 42.1 |
| Highton South | 45.0 | 42.1 |
| Lara | 32.8 | 37.3 |
| Leopold North | 61.0 | 62.9 |
| Leopold | 72.5 | 62.9 |
| Leopold East | 65.0 | 62.9 |
| Marshall | 39.6 | 47.3 |
| Manifold Heights | 50.0 | 41.9 |
| Moolap | 38.2 | 61.0 |
| Waurn Ponds | 46.0 | 47.3 |
| Whittington | 41.4 | 47.3 |
| URBAN AREA AVERAGE | 45.0 | 46.4 |
