
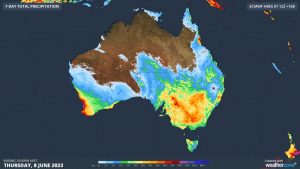
Wet Weather for June 2023.
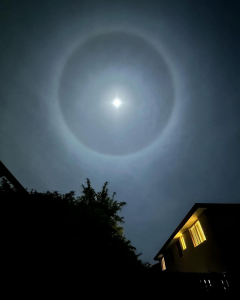
Moon halo caused by a faintly-coloured ring that appears when ice crystals within thin layers are often associated with cirrus clouds.
SUMMARY
Geelong was wetter than normal and warmer than the 30-year average.TEMPERATURE
Geelong was warmer than normal with 1.0 C above the 30-year average. The top temperature was 18.9 C on the 16th and the bottom temperature was 0.7 C on 21st. Warmest night was 11.4 C on the 8th and the lowest maximum temperature was 11.1 C on the 19th.RAINFALL
Widespread rainfall occurred across most of the Geelong region with 10-15% of the average figures falling above the 30-year average. Details below.OTHER FEATURES
Two days occurred on the 9th and the 26th when the wind gusts reached 65 km/h and 61 km/h, stronger than normal.RAINFALL DATA
| GEELONG REGION | ||
| Location | Total for Month (mm) | Monthly Average (mm) |
| Aireys Inlet | 67.4 | 66.8 |
| Anakie | 35.0 | 49.0 |
| Apollo Bay | 65.0 | 109.8 |
| Bacchus Marsh | na | 38.6 |
| Ballarat Aero | 96.6 | 64.7 |
| Beech Forest (Otway Fly) | 204.6 | 199.8 |
| Benwerrin | 120.2 | na |
| Boonah | 108.0 | na |
| Cape Otway | 146.6 | 98.0 |
| Colac | 111.0 | 56.8 |
| Curlewis | na | 36.8 |
| Dereel | na | 65.0 |
| Drysdale | 51.4 | 62.5 |
| Forrest (West Barwon Dam) | na | 125.0 |
| Inverleigh | 61.8 | 46.7 |
| Lal Lal | 53.6 | na |
| Laverton | 42.4 | 38.0 |
| Lorne | 114.6 | 125.2 |
| Melbourne (City) | 49.2 | 50.0 |
| Meredith (Darra) | 45.6 | 57.9 |
| Moriac | 77 | 53.0 |
| Mt Buninyong | 83.2 | na |
| Mt Cowley | 139.4 | na |
| Mt Gellibrand | 77.0 | na |
| Mt Mercer | 57.2 | na |
| Mt Sabine | 147.4 | na |
| Ocean Grove | na | na |
| Point Lonsdale | 53.8 | 58.0 |
| Shelford | 58.2 | 47.0 |
| Sheoaks | 49.4 | na |
| Sutherlands Creek | 48.0 | 45.0 |
| Winchelsea | 81.6 | 48.5 |
| GEELONG SUBURBS | ||
| Location | Total for Month (mm) | Monthly Average (mm) |
| Armstrong Creek | 54.6 | 35.6 |
| Avalon | 40.8 | 35.6 |
| Belmont (1) | 58.0 | 43.9 |
| Belmont (2) | 68.8 | 43.9 |
| Breakwater Racecourse | 53.6 | 46.4 |
| Charlemont | na | 48.7 |
| Corio | 45.0 | 40.0 |
| Grovedale | 48.5 | 42.2 |
| Grovedale South | 63.8 | 42.2 |
| Hamlyn Heights | 45.1 | 42.0 |
| Herne Hill | 62.0 | 42.0 |
| Highton North | 63.0 | 42.1 |
| Highton South | 66.2 | 42.1 |
| Lara | 32.8 | 37.3 |
| Leopold North | 54.0 | 62.9 |
| Leopold | 48.8 | 62.9 |
| Leopold East | 51.2 | 62.9 |
| Marshall | 58.6 | 47.3 |
| Manifold Heights | 48.4 | 41.9 |
| Moolap | 45.0 | 61.0 |
| Waurn Ponds | na | 47.3 |
| Whittington | 50.0 | 47.3 |
| URBAN AREA AVERAGE | 60.0 | 46.4 |