TEMPERATURE
Another above average temperature month was experienced across the Geelong Region in March. The mean daily temperature was 18.95 degrees C, almost a full degree above the latest 30-year average of 18.0 C.
There were 3 days over 30 degrees: these days were all Saturdays (3rd, 10th and 17th) and the hottest day registered 34.8 C on the 17th. On the coldest day (20th) only 18.8 C was reached. On the warmest night (24th) the mercury only fell to 17.6 C and the coldest night was the 31st when the temperature fell to 8.5 C.
RAINFALL
Average Geelong urban rainfall was a little over 24 mm, just 4 mm short of the latest 30-year average which totals 28 mm for March.
On the 25th, the highest rainfall day (just 8 in total) 15.6 mm fell at Breakwater, one of a few days characterised by lightning, thunder strong winds, but no severe damage.
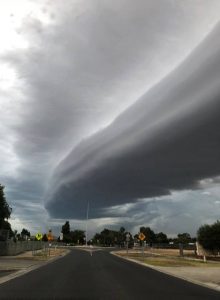
The BoM photo below shows the same cold front shelf cloud that crossed Geelong on the 24th.
OTHER FEATURES
There were several other notable events for the month: one thunder-lightning day on the 24th, 4 days of strong wind gusts (max 76 km/h on the 25th), and widespread Otway Region fires with few casualties on the 18th. All up, a warmer and marginally drier March.
RAINFALL DATA
GEELONG REGION |
||
Location |
Total for Month (mm) |
Monthly Average (mm) |
| Aireys Inlet | 30.8 | 45.7 |
| Anakie West | 21.5 | 35.6 |
| Anglesea | na | 41.0 |
| Apollo Bay | na | 69.6 |
| Bacchus Marsh | 21.6 | 26.0 |
| Ballan | na | 34.0 |
| Ballarat | 34.8 | 44.4 |
| Balliang | 17.6 | 24.4 |
| Balliang East | 18.0 | 24.4 |
| Bannockburn | na | 39.0 |
| Barwon Heads | na | 43.0 |
| Beech Forest (Fly) | 101.0 | 100.6 |
| Bellbrae | na | 37.7 |
| Bells Beach | na | 37.7 |
| Beeac | na | 40.4 |
| Benwerrin | 50.8 | 65.0 |
| Birregurra | 32.6 | 41.4 |
| Boonah | 46.2 | 35.0 |
| Cape Otway | 52.0 | 55.8 |
| Clifton Springs | na | 59.0 |
| Colac | na | 44.2 |
| Cressy | na | 45.0 |
| Curlewis | na | 35.6 |
| Curlewis Golf Club | 16.0 | 35.6 |
| Dereel | 26.6 | 46.0 |
| Drysdale | na | 59.4 |
| Durdidwarrah | na | 53.1 |
| Forrest (West Barwon) | na | 69.5 |
| Inverleigh | 14.0 | 43.0 |
| Lal Lal | 23.4 | 54.4 |
| Laverton | 17.6 | 36.0 |
| Lorne | 16.0 | 36.0 |
| Melbourne (City) | 22.2 | 52.0 |
| Melton | 25.2 | 52.0 |
| Meredith (Darra) | na | 51.6 |
| Moriac | na | 35.0 |
| Mount Gellibrand | 24.0 | 50.8 |
| Mount Cowley | 49.2 | 66.1 |
| Mount Mercer | 22.2 | 50.5 |
| Mount Sabine | 31.2 | 110.2 |
| Ocean Grove | 22.8 | 43.0 |
| Point Lonsdale | 20.6 | 45.6 |
| Pollocksford | 22.2 | 40.6 |
| Queenscliff | 16.6 | 44.5 |
| Scotsburn | 18.2 | 58.0 |
| Shelford | 16.8 | 38.0 |
| Sheoaks | 23.6 | 38.0 |
| Skipton | na | 38.0 |
| St Leonards | 33.4 | 45.0 |
| Sutherlands Creek | 25.2 | 35.0 |
| Werribee | na | 30.8 |
| Werribee South | 18.0 | 30.8 |
GEELONG SUBURBS |
||
| Location | Total for Month (mm) | Monthly Average (mm) |
| Armstrong Creek | 24.2 | 30.3 |
| Avalon | 22.6 | 31.0 |
| Bell Post Hill | 21.7 | 37.4 |
| Belmont | 22.0 | 31.9 |
| Breakwater | 24.0 | 28.1 |
| Charlemont | 20.4 | 27.0 |
| Corio | 23.9 | 35.0 |
| East Geelong | na | 32.0 |
| Grovedale | 24.8 | 31.7 |
| Grovedale South | 24.8 | 31.7 |
| Hamlyn Heights | na | 35.0 |
| Herne Hill | 25.0 | 32.0 |
| Highton | 22.2 | 32.0 |
| Lara | 21.8 | 36.6 |
| Leopold | 33.0 | 32.9 |
| Leopold East | na | 32.5 |
| Manifold Heights | 26.6 | 32.5 |
| Marshall | 23.2 | 32.5 |
| Moolap | 20.6 | 32.5 |
| North Shore | 34.3 | 30.3 |
| Whittington | 25.0 | 32.0 |
| Urban Area Average | 24.0 | 28.0 |

