SUMMARY
March was warmer than average and well below average rainfall as measured against the most recent 30-year means. In fact, Geelong has just had its equal third driest January to March period since records began in 1871.

Only a few millimetres of rain fell from this wild, wooly, wind-swept cumulus set-up in Marshall on the 6th.
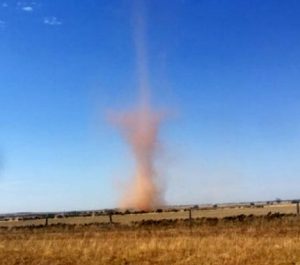
A dust devil or willy-willy adjacent to the Bacchus Marsh Road, north of Corio, on the 1st. This one and several others in Lara, Pt Addis and Belmont were noted on the very hot and still days in Geelong from the 1st to the 3rd. Photo courtesy Bay FM.
TEMPERATURE
March was warmer than average by about 1.4 C. There were five days over 30 C including 39.3 C on the first and on the coldest day (30th) the mercury only rose to 16.8 C.
The overnight lowest temperature was 6.9 C on the 14th and the highest was 21.6 C on the 2nd.
This has been the sixth consecutive month of above average temperatures but no records have been broken.
RAINFALL
March was the third month in a row of very meagre rainfall – the driest January to March period since 1965 – across virtually the whole region except for a small area of the Otways around Beech Forest.
Geelong rainfall ranged from 6.0 mm at Belmont to 18.8 mm at both North Shore and Grovedale. Rain only fell on 9 days and the Barwon Water Catchment was recorded at 38 % of capacity at the end of the month.
Normally in March we would expect 28.0 mm – Geelong’s driest month anyway.
OTHER FEATURES
There were three gusty wind days over 60 km/h: the strongest gust was 82 km/h on the 25th. Somewhat surprisingly there was only one thunder day, on the evening of the 25th.
As shown in some of the photos on this page there were several interesting features of the month’s weather despite the desperately low rainfalls and the warmer than average temperatures.
On the first 3 days of the month local willy-willies were photographed around Geelong during very hot, dry and reasonably calm days in the high 30’s.
Then during a poor storm on the 6th and 7th hail was recorded in some southern suburbs.
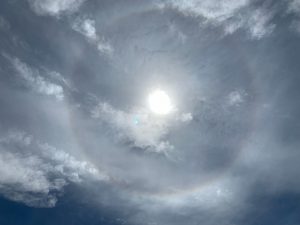
This was followed by a mixture of smoke, haze and some fog on the 9th and 10th, the smoke haze drifting from the Gippsland fires.
On the 20th and 21st the sun was not to be seen for most of the day as overcast but dry conditions dominated the region.
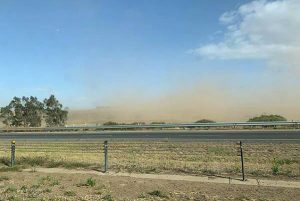
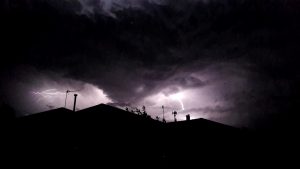
The 25th provided a truly typical autumnal range of weather in 24 hours; during the day the temperature only rose to 18.2 C, the wind built up remarkably causing some local damage to trees, there were several local raised dust areas and there was a small amount of hail in the afternoon. This was followed at night by some small, fast moving storms to the south of Geelong affording some photographers excellent photo opportunities.
Finally during the 30th the top temperature was decidedly wintry (16.8 C) and the best rain fell on most of Geelong for the month (4.6 mm in Breakwater and up to 8 mm elsewhere). So ended March 2019.
RAINFALL DATA
GEELONG REGION |
||
Location |
Total for Month (mm) |
Monthly Average (mm) |
| Aireys Inlet | 32.0 | 45.7 |
| Anakie West | 9.5 | 35.6 |
| Anglesea | 22.6 | 41.0 |
| Apollo Bay | 63.3 | 69.6 |
| Bacchus Marsh | 20.0 | 26.0 |
| Ballan | 28.0 | 34.0 |
| Ballarat | 15.6 | 44.4 |
| Balliang East | 5.8 | 24.4 |
| Barwon Downs | 17.8 | 45.0 |
| Barwon Heads | 16.1 | 43.0 |
| Beech Forest (Fly) | 121.6 | 100.6 |
| Bellbrae | na | 37.7 |
| Bells Beach | 17.8 | 37.7 |
| Beeac | 18.4 | 40.4 |
| Benwerrin | 53.2 | 65.0 |
| Birregurra | na | 41.4 |
| Boonah | 53.6 | 35.0 |
| Cape Otway | 69.9 | 55.8 |
| Clifton Springs | na | 59.0 |
| Colac | 31.0 | 44.2 |
| Cressy | na | 45.0 |
| Curlewis | 18.0 | 35.6 |
| Curlewis Golf Club | 13.6 | 35.6 |
| Dereel | 23.2 | 46.0 |
| Drysdale | na | 59.4 |
| Forrest (West Barwon) | 19.8 | 69.5 |
| Inverleigh | 12.5 | 43.0 |
| Lal Lal | 10.8 | 54.4 |
| Laverton | 8.8 | 36.0 |
| Lorne | 22.8 | 36.0 |
| Melbourne (City) | 12.0 | 52.0 |
| Melton | 10.2 | 52.0 |
| Meredith (Darra) | 15.8 | 51.6 |
| Moriac | na | 35.0 |
| Mount Gellibrand | 30.4 | 50.8 |
| Mount Cowley | 78.0 | 66.1 |
| Mount Mercer | 12.8 | 50.5 |
| Mount Sabine | 60.2 | 110.2 |
| Ocean Grove | 20.4 | 43.0 |
| Point Lonsdale | 15.0 | 45.6 |
| Queenscliff | 12.8 | 44.5 |
| Scotsburn | 11.6 | 58.0 |
| Shelford | 10.8 | 38.0 |
| Sheoaks | 11.0 | 38.0 |
| Skipton | na | 38.0 |
| St Leonards | 18.4 | 45.0 |
| Sutherlands Creek | 10.6 | 35.0 |
| Werribee | 9.2 | 30.8 |
| Werribee South | 6.6 | 30.8 |
GEELONG SUBURBS |
||
| Location | Total for Month (mm) | Monthly Average (mm) |
| Armstrong Creek | 17.4 | 30.3 |
| Avalon | 6.8 | 31.0 |
| Bell Post Hill | na | 37.4 |
| Belmont | 6.0 | 31.9 |
| Breakwater | 8.6 | 28.1 |
| Charlemont | 8.6 | 27.0 |
| Corio | 7.0 | 35.0 |
| Grovedale | 18.8 | 32.0 |
| Grovedale East | 16.8 | 31.7 |
| Grovedale South | 15.8 | 31.7 |
| Hamlyn Heights | 12.7 | 35.0 |
| Herne Hill | 7.0 | 32.0 |
| Highton | 11.8 | 32.0 |
| Lara | 9.0 | 36.6 |
| Leopold | 18.0 | 32.9 |
| Leopold East | na | 32.5 |
| Manifold Heights | 11.3 | 32.5 |
| Marshall | 15.2 | 32.5 |
| Moolap | 12.0 | 32.5 |
| North Shore | 18.8 | 30.3 |
| Queens Park | 10.4 | 32.0 |
| Whittington | 11.0 | 32.0 |
| Urban Area Average | 12.0 | 28.0 |

