TEMPERATURE
“Another warm month,” was Lindsay Smail’s comment on what may seem to many people to have been a cool May. But in fact May’s average daily minimum of 9.6 degrees C exceeded the latest 30-year average by 1.3 degrees, and the average daily maximum of 17.6 C surpassed the average by 0.5 degrees. The overall result shows a warmer month by nearly one degree C.
Top temperature of 24.8 C on the 2nd and numerous warm days and nights throughout May contributed to the higher figure, but a minimum of 2.4 C on the morning of the 26th gave us a taste of the wintry months ahead, as did the light snow on the Otway Ridge on the 10th.
RAINFALL
A very welcome month of above average rainfall over 15 days resulted in an urban area average figure of around 60 mm, compared to the mean of 38.8 mm. Bell Post Hill was the driest suburb with 39.5 mm and Leopold East was the wettest with 69.1 mm. On the wettest day (the 11th) just on 20 mm fell at the Breakwater Racecourse, and more in other suburbs.
OTHER FEATURES
There were two very windy days (4th and 11th) and an 85 km/h gust brought some brief hail in some places on the 11th.
Geelong’s water catchments are showing 49% of capacity and winter rainfall is not expected by the Bureau to be above average.
The Bureau of Meteorology lost track of Geelong’s maximum temperature on the 21st when a Telstra outage took place but GWS has patched that figure to 15.8 C.
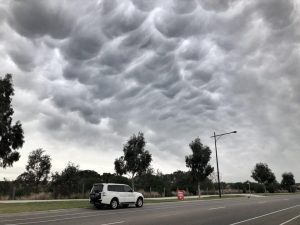
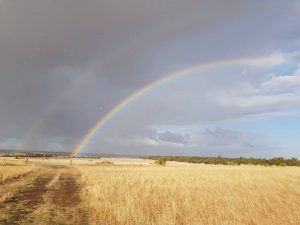
The photos below show mammatus cloud over the Grovedale area on the 18th and a double rainbow at Mt Mercer on the same day.
AUTUMN SUMMARY
Overall autumn was warmer in all three months and slightly drier owing mainly to a very dry April.
RAINFALL DATA
|
|
||||||||||||||||||||||||||||||||||||||||||||||||||||||||||||||||||||||||||||||||||||||||||||||||||||||||||||||||||||||||||||||||||||||||||||||||||||||||||||||||||||||||||||||||||||||||||||||


