TEMPERATURE
It was Geelong’s warmest November since 1903 when accurate records began.
The overall average November figures were 12.9 C for minimums and 24.6 C for maximums, well above the November means of 10.3 C for minimums and 21.3 C for maximums.
Two distinct temperature phases occurred in November: from the first to the 12th the maximum and minimum daily temperatures only averaged 13.3 degrees C, which is 2.5 C below the long-term mean. But from the 13th onward the mean was an incredible 22C, or 7 full degrees C above normal.
There were seven days over 30 degrees, the highest being 35.4 C on the 14th. The coldest overnight temperature was 4.2 C on the 5th and the warmest overnight was 22.1 C on the 30th.
RAINFALL
Over most of central Geelong rainfall was above average, largely brought about by a terrific thunderstorm in the early hours of the 27th, when 26 mm fell in half an hour at Breakwater. The rest of Geelong was not in the direct firing line, but still averaged around 50 mm compared to the long-term normal of 52.4 mm.
Most of the Bellarine Peninsula and the Otways received below average totals, except for Moolap and Curlewis areas.
Water catchments are presently around 73% of capacity.
OTHER FEATURES
There were 8 thunder days and two funnel clouds were reported from the Inverleigh and Winchelsea districts on the 17th.
A small earthquake (3.0) occurred just north of Bannockburn around 3.10 am on the 18th and was heard in Corio and Lara but there was no visible damage.
Eastern Beach was closed due to nearby lightning on the 26th.
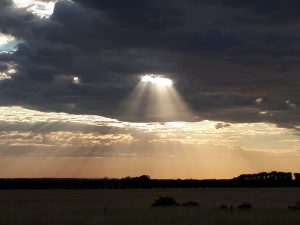
Break in the cloud at Lethbridge on 15th. Courtesy Nathan Combridge.
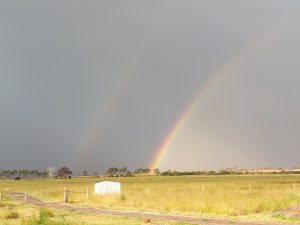
Lethbridge double rainbow on 15th. Courtesy Nathan Combridge.
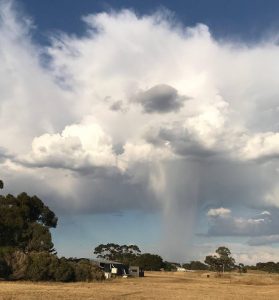
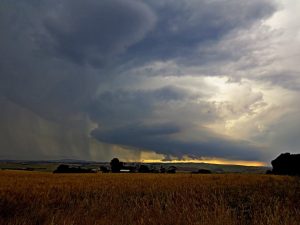
Cloudburst over Avalon
Photo Courtesy Harry de Wit
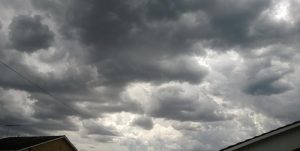
Storm at Ceres. Photo courtesy Harry de Wit
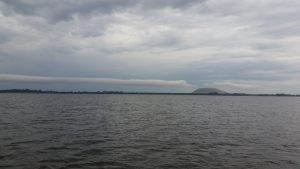
Sausage-Shaped Cloud at Mt Elephant. Photo courtesy Doug Smail.
SPRING SUMMARY – Warmer than normal
| Month | Av Tmin | 30-yr Av Min | Av Tmax | 30-yr Av Max |
| Sept | 7.1 | 7.2 | 17.1 | 17.1 |
| Oct | 9.5 | 8.4 | 20.6 | 19.3 |
| Nov | 12.9 | 10.3 | 24.6 | 21.3 |
| SPRING | 9.8 | 8.6 | 20.8 | 19.2 |
RAINFALL DATA
|
|
||||||||||||||||||||||||||||||||||||||||||||||||||||||||||||||||||||||||||||||||||||||||||||||||||||||||||||||||||||||||||||||||||||||||||||||||||||||||||||||||||||||||||||||||||||||||||||||||||||||||||||||||||||||

