SUMMARY

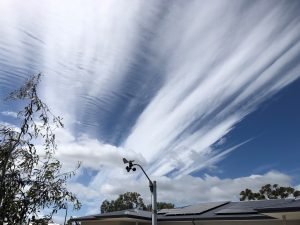
Wind-blown low clouds on the 16th over Barwarre Gardens.

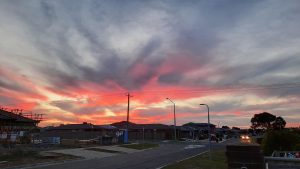
Sunset on the 9th over Barwarre Gardens. Photo courtesy David Ridley.
RAINFALL
Despite a low total rainfall until November 22nd, the Geelong region excluding most of the Otway Ranges received above average rainfall over 60 mm when the month concluded. Detailed monthly figures are shown at the tables below.
TEMPERATURE
Temperatures averaged 2.1 degrees warmer than the latest 30-year average based on maximums and minimum temperatures.
Minimum temperatures averaged 12.3 C compared to 10.3 C and maximum figures averaged 23.6 C compared to 21.4 C. Geelong’s warmest overnight minimum was 21.4 C on the 11th and of the six warmest days over 30 C it reached 35.3 C on the 19th.
OTHER FEATURES
There were two thunder days on the 11th and the 22nd and two very strong wind gusts which recorded 72 km/h on the 15th and 89 km/h on the 16th at Breakwater AWS.
SUMMARY OF SPRING THIS YEAR
During spring this year Geelong was 2.2 C warmer than the latest 30-year average by degrees.
WARMEST SPRING MAXIMUM TEMP: 35.3 C on 19th November.
COLDEST MINIMUM TEMP: 2.1 C on September.
WETTEST DAY: 36.4 mm on 23rd November.
WINDIEST DAY: 89 km/h on 16th November.
RAINFALL: 249 mm compared to 147.6 mm average.
| GEELONG REGION |
| Location |
Total for
Month
(mm) |
Monthly
Average
(mm) |
| Aireys Inlet |
67.4 |
59.7 |
| Anakie |
51.9 |
55.0 |
| Anglesea |
75.2 |
55.0 |
| Apollo Bay |
4.2 |
81.7 |
| Ballan |
51.0 |
59.0 |
| Ballarat |
66.6 |
56.0 |
| Bannockburn |
78.6 |
47.0 |
| Barwon Heads |
na |
53.0 |
| Bellbrae |
50.7 |
51.2 |
| Bells Beach |
68.6 |
na |
| Beeac |
na |
52.1 |
| Beech Forest (Otway Fly) |
97.2 |
na |
| Boonah |
64.8 |
n.a. |
| Cape Otway |
21.6 |
64.1 |
| Colac |
42.4 |
57.7 |
| Curlewis |
63.7 |
42.0 |
| Drysdale |
70.8 |
41.9 |
| Dereel |
73.4 |
58.9 |
| Forrest (West Barwon) |
68.2 |
88.2 |
| Inverleigh |
91.4 |
47.2 |
| Lorne |
74.6 |
61.7 |
| Laverton |
55.4 |
52.0 |
| Melbourne (City) |
47.8 |
60.0 |
| Meredith (Darra) |
63.0 |
60.7 |
| Moriac |
na |
59.4 |
| Mt Gellibrand |
62.2 |
n.a. |
| Mt Buninyong |
45.0 |
n.a. |
| Mt Cowley |
58.0 |
n.a. |
| Mt Mercer |
64.2 |
50.8 |
| Mt Sabine |
76.6 |
107.1 |
| Ocean Grove |
56.2 |
n.a. |
| Point Lonsdale |
na |
48.0 |
| Pollocksford |
64.2 |
n.a. |
| Queenscliff |
48.3 |
49.0 |
| Shelford |
80.5 |
48.5 |
| Sheoaks |
55.0 |
50.0 |
| Skipton |
62.0 |
n.a. |
| St Leonards |
59.8 |
50.0 |
| Sutherlands Creek |
61.4 |
na |
| Wensleydale |
65.6 |
50.0 |
| Werribee South |
44.2 |
n.a. |
| Winchelsea |
56.4 |
50.0 |
| Wooloomanata |
65.4 |
na |
| Wurdi Boluc |
36.4 |
48.1 |
|
 |
| GEELONG SUBURBS |
| Location |
Total for
Month
(mm) |
Monthly
Average
(mm) |
| Armstrong Creek |
71.2 |
39.9 |
| Avalon |
73.4 |
39.9 |
| Bell Post Hill |
70.6 |
49.5 |
| Belmont |
41.0 |
50.6 |
| Breakwater Racecourse |
63.4 |
51.0 |
| Charlemont |
62.3 |
52.4 |
| Corio |
84.4 |
45.0 |
| Grovedale |
64.5 |
50.6 |
| Grovedale South |
59.7 |
50.6 |
| Hamlyn Heights |
na |
56.4 |
| Herne Hill |
75.0 |
56.4 |
| Highton |
85.8 |
50.4 |
| Lara |
81.8 |
40.9 |
| Lovely Banks |
98.8 |
40.9 |
| Leopold |
63.6 |
60.0 |
| Leopold North |
60.0 |
60.0 |
| Manifold Heights |
71.4 |
48.8 |
| Moolap |
54.8 |
48.8 |
| Moolap (Salt) |
63.2 |
48.8 |
| Queens Park |
63.6 |
52.8 |
| Whittington |
65.0 |
54.0 |
| Urban Geelong Average |
75.0 |
49.5 |
|


