October 4th at Connewarre. Photo Phil Thomson.

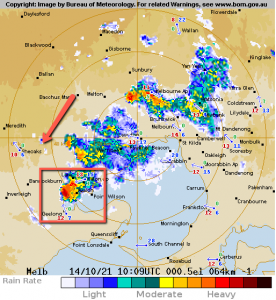
Photo and associated radar image over Geelong northern suburbs on the 14th. Notice extreme rainfall over Lara, Corio and Norlane.
SUMMARY
It was a very wet month and fractionally cooler than average for October (see all details below).
TEMPERATURE
Geelong’s daily maximums averaged 18.7 C compared to the long-term figure of 19.4 C. The daily minimums averaged 8.6 C compared to the long-term 8.5 C. This resulted in a cooler month of around 0.3 C below average.

Lightning over Geelong on the 28th. Photo courtesy Doug Lindsay.
Top temperature recorded was 27.8 C on the 27th and the lowest was 3.5 C on the 12th. The coldest days were 14.9 C on the 15th and 25th and the highest overnight temperature reached 13.7 C on the 21st.
RAINFALL
Geelong’s total rainfall exceeded well above 100 mm, with two severe storms in the northern suburbs on the 14th and across most of Geelong on the 28th. The wettest days occurred on the 1st (15.6 mm), the 14th (13.8 mm), the 23rd (26.8 mm) and the 28th (18.6 mm). Rain fell over 20 days. Most of the region recorded around double the monthly average.
OTHER FEATURES
There were several other features of Geelong’s weather last month, including a severe storm over the northern suburbs on the 14th which included 37 mm at Lara with hail and flash flooding. Also there were two days on which extreme wind gusts at Breakwater of 85 km/h on the 29th (Avalon 98) and 69 km/h on the 4th (Avalon 72). This last day was followed by a gust of 59 km/h on the 5th.
On four days (14th, 15th, 22nd and 28th) there was thunder and lightning with two severe storms as mentioned above. Extreme thunder-lightning days on the 28th over most suburbs led to tree and building damage, strong winds, loud thunder, some flash flooding, wild sheet lightning, power outages and some large hail across Geelong and Bellarine Peninsula.
Water catchments averaged 97% of capacity – the best since 2012.
RAINFALL DATA
![]()
| GEELONG SUBURBS | ||
 Location Location |
Total for Month (mm) |
|
| Armstrong Creek | 126.2 | 55.9 |
| Avalon | 87.4 | 40.9 |
| Bell Post Hill | na | 55.9 |
| Belmont | 98.0 | 57.0 |
| Breakwater Racecourse | 114.0 | 49.0 |
| Charlemont | 105.8 | 57.5 |
| Corio | 104.0 | 54.0 |
| Grovedale | 119.0 | 52.8 |
| Grovedale South | 120.8 | 56.3 |
| Hamlyn Heights | 114.0 | 50.6 |
| Highton | 117.0 | 56.1 |
| Lara | 127.0 | 46.0 |
| Leopold | 121.0 | 64.0 |
| Leopold East | 129.4 | 64.0 |
| Manifold Heights | 120.1 | 50.8 |
| Marshall | 109.4 | 50.8 |
| Moolap | 99.6 | 57.0 |
| Queens Park | 114.0 | 51.0 |
| Waurn Ponds | 95.0 | 50.0 |
| Whittington | 117.8 | 53.5 |
| Urban Geelong Average | 115.0 | 49.0 |

