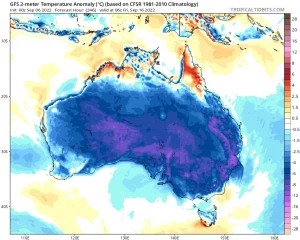
Australian temperatures showing lower than normal September temperatures. Courtesy Weatherzone.
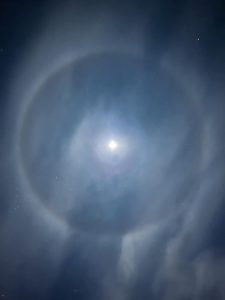
Lunar Halo over Geelong on 6th Sept 2022. Photo courtesy Peter Redmond.
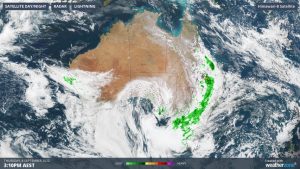
2000 km arc of rainfall distribution over most of the Murray-Darling Basin early September. Courtesy Weatherzone.
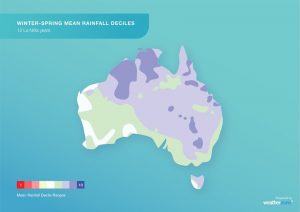
SUMMARY
Image: Observed rainfall deciles during 12 past La Niña winter-spring periods combined, showing that large areas of Australia typically experience above-average rain during La Niña.
The increased cloud cover and rainfall during La Niña also promotes cooler-than-average daytime temperatures across Australia, but warmer than average night-time temperatures.
Heat extremes are generally less frequent during La Niña years, while prolonged spells of lower-intensity heat are generally more common.
The warm oceans near northern Australia make La Niña favourable for tropical cyclone development. La Niña also increases the likelihood of an earlier-than-usual start to the cyclone season and Australia’s northern wet season.
Geelong’s La Nina rainfall indicates a 60-70% chance of above average rainfall during winter-spring. Geelong’s weather station recorded 46.0 mm just fractionally below the average of 50.8 mm. The urban average was 50.0 mm this month.

Tornadic Funnel over Mt Moriac on 26-9-22. Courtesy Victorian Storm Chasers.
TEMPERATURE
Geelong’s average daily temperatures reached 16.2 degrees (maximum) and 7.7 degrees (minimum) compared to the 30-years average of 17.1 C and 7.2C. This means Geelong’s temperatures were 0.2 C below average.
Top temperature was 20.9 C on the 9th, and 12.9 C on the 2nd. Lowest temperature was 0.7 C on the 14th and 12.0 C on the 23rd and 28th.
RAINFALL
Geelong’s average urban area rainfall varied from 32.6 mm at Avalon to over 55.0 mm at Charlemont and Grovedale. (See details below). Rain resulted on 20 days and the maximum figure was 9.2 mm on the 15th.
OTHER FEATURES
A funnel cloud over Mt Moriac in Geelong’s southwest failed to touch the surface resulting in strong winds about 1.40 pm on the 26th. See photo above.
One thunder day occurred on the 18th and one frost occurred on the 14th when the minimum temperature of 0.7 C was reached.
RAINFALL DATA
![]()

