April 2015

 TEMPERATURE

Another colder than normal month characterised April.  Geelong was around 0.6 degrees cooler than the current 30-year average and 0.7 cooler than the complete record from 1902.  The main factors contributing to this result were that days were much colder than average and nights were fractionally higher.

Maximum was 29.6 degrees on the 1st and the lowest minimum was 4.3 C on the 13th and 30th.  The 19th was the coldest day (15.0 C) and the night of the 14-15th had the warmest minimum (14.5 C).   This cooler result for March and April was not predicted by the BoM for Geelong.

RAINFALL

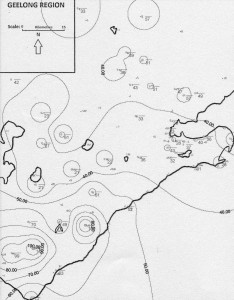
Below average rainfall was received across most of the Geelong region.  Some Western District towns barely scored half the normal.  Some Geelong suburbs (eg, Corio) recorded the average figure but the urban area average (34mm) and the Breakwater AWS (28.4 mm) were very disappointing.  In the Otways Mt Sabine, at the head of Geelong’s West Barwon catchment received a whopping 233 mm – this figure is to be confirmed.

Water catchments remain on 59% of capacity.

Please click on the regional isohyet map image to increase size.

APRIL 2015 ISOHYETS (2)

RAINFALL DATA

GEELONG REGION
Location Total for
Month
(mm)
Monthly
Average
(mm)
Aireys Inlet 52.2 50.5
Anakie 51.0 41.0
Anglesea na 56.0
Apollo Bay 63.0 85.2
Bacchus Marsh na 42.4
Ballan 57.2 55.5
Ballarat 32.8 53.8
Bannockburn 32.6 42.0
Barwon Heads GC 30.6 51.0
Beech Forest 110.6 147.3
Bellbrae na 52.4
Bells Beach na 52.4
Beeac 27.4 45.5
Birregurra 26.6 48.8
Boonah 61.4 n.a.
Cape Otway 47.4 72.3
Colac 21.2 59.0
Clifton Springs 36.4 48.3
Cressy 23.0 50.2
Curlewis 40.3 48.0
Drysdale na 48.3
Durdidwarrah 51.4 n.a.
Forrest (Town) na 83.1
Forrest (West Barwon) 49.4 75.9
Gellibrand 69.6 77.5
Inverleigh na 48.0
Johanna Heights na 130.0
Lal Lal na n.a.
Lavers Hill na 148.0
Laverton 34.2 49.0
Lethbridge na 57.0
Little River (You Yangs) 47.0 43.2
Melba Gully na n.a.
Melbourne (City) 36.8 58.0
Meredith (Darra) 41.6 58.2
Moriac 36.2 45.0
Morrisons na n.a.
Mt Cowley 100.4 n.a.
Mt Gellibrand 21.2 n.a.
Mt Mercer 38.6 n.a.
Mt Sabine 233.2 n.a.
Point Lonsdale 26.3 52.0
Pollocksford 24.2 n.a.
Portarlington na 53.6
Queenscliff na 48.3
Shelford na 44.0
Sheoaks 42.6 n.a.
Skipton 42.4 n.a.
St Leonards 54.5 50.0
Sutherlands Creek na 42.0
Teesdale na 46.0
Torquay na 45.0
Werribee na 46.0
Winchelsea 22.0 40.0
Wyelangta 99.0 163.8


GEELONG SUBURBS
Location Total for
Month
(mm)
Monthly
Average
(mm)
Avalon 49.4 46.7
Bell Park 33.0 45.1
Belmont 37.0 43.5
Breakwater 28.4 45.4
Connewarre 32.7 41.0
Corio 39.2 39.0
East Geelong 34.5 39.0
Grovedale 43.0 43.5
Grovedale South 35.2 43.5
Hamlyn Heights 33.8 43.0
Highton na 43.4
Lara na 39.1
Lara (Serendip) 57.0 39.1
Leopold 28.0 50.2
Leopold East 36.9 50.2
Manifold Heights  37.4 43.0
Moolap  na 45.0
Waurn Ponds 31.6 44.0
Whittington na 43.0
Geelong Urban Area Average 34.0 42.0

Post navigation