April 2017

RAINFALL

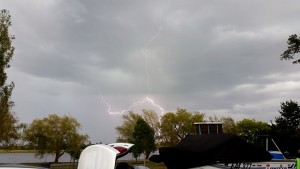
Two extreme weather events occurred in Geelong in April.  Both were classed as severe storms and both involved high rainfalls, flash flooding, thunder, lightning and strong southwesterly winds.

In fact, the month’s total rainfall of 151 mm resulted in Geelong having the second highest figure ever recorded in April (ie, since 1871).

The first event occurred on the 8th and 9th, when almost 60 mm fell across the city (including 107 mm at Ocean Grove and 106 mm at Drysdale), and the second was on the evening of the 24th when over 50 mm fell in a violent storm across the urban area.

The whole region was well above the monthly average, with urban Geelong 380% above.  Geelong’s average April rainfall is 39.8 mm.

TEMPERATURE

Temperatures averaged 20.5 degrees C for maximums and 11.0 C for minimums – a mean of 15.8C.  This was 0.7 C above the mean April temperature of 15.1 C.  Top temperature was 29.9 C on the 8th and lowest overnight was 6.5 C on the 18th.

OTHER FEATURES

Two severe storms with damaging flash flooding (9th and 24th).  Two hail days (24th and 26th).  Three thunder/lightning days (8th, 9th and 24th). Three strong wind days (9th – 83 kph, 10th – 70 kph and 26th – 61 kph).


Point Lonsdale Flooding, April 26th, 2017.  Photo courtesy A. Coots.

Point Lonsdale Flooding, April 26th, 2017. Photo courtesy A. Coots.


Lake Wendouree 8-5-17.  Photo courtesy D.Smail.

Lake Wendouree April 8th, 2017. Photo courtesy D.Smail.


RAINFALL DATA

GEELONG REGION
Location Total for
Month
(mm)
Monthly
Average
(mm)
Aireys Inlet 95.0 50.5
Anakie 92.2 41.0
Anglesea na 56.0
Apollo Bay 123.1 85.2
Bacchus Marsh 84.0 42.4
Ballan 74.0 55.5
Ballarat 101.0 53.8
Bannockburn 112.6 42.0
Barwon Heads GC 142.8 51.0
Beech Forest 186.6 147.3
Bellbrae 167.0 52.4
Bells Beach 124.2 52.4
Beeac 125.9 45.5
Birregurra na 48.8
Boonah 137.2 n.a.
Cape Otway 100.0 72.3
Colac 101.4 59.0
Clifton Springs na 48.3
Cressy na 50.2
Curlewis 172.2 48.0
Drysdale 171.2 48.3
Durdidwarrah 188.0 n.a.
Forrest (Town) na 83.1
Forrest (West Barwon) 140.4 74.3
Gellibrand na 77.5
Inverleigh 155.5 48.0
Johanna Heights na 130.0
Lal Lal 118.6 n.a.
Lavers Hill na 148.0
Laverton 96.0 49.0
Lethbridge 85.6 57.0
Melba Gully na n.a.
Melbourne (City) 123.0 58.0
Meredith (Darra) 103.6 58.2
Moriac na 45.0
Morrisons na n.a.
Mt Cowley 147.2 n.a.
Mt Gellibrand 113.0 n.a.
Mt Mercer 98.2 n.a.
Mt Sabine 100.6 n.a.
Point Lonsdale 99.4 52.0
Pollocksford 110.6 n.a.
Portarlington na 53.6
Queenscliff 81.0 48.3
Shelford na 44.0
Sheoaks 110.6 n.a.
Skipton na n.a.
St Leonards 83.0 50.0
Sutherlands Creek 99.8 42.0
Teesdale na 46.0
Torquay na 45.0
Werribee 74.0 46.0
Winchelsea na 40.0
You Yangs na 35.0


GEELONG SUBURBS
Location Total for
Month
(mm)
Monthly
Average
(mm)
Avalon 114.6 46.7
Bell Park 127.6 45.1
Belmont 156.5 43.5
Breakwater 151.2 45.4
Connewarre na 41.0
Corio 151.7 39.0
East Geelong 150.4 39.0
Grovedale 183.0 43.5
Grovedale South 184.0 43.5
Hamlyn Heights 144.8 43.0
Highton 153.2 43.4
Lara 123.8 39.1
Lara (Serendip) na 39.1
Leopold 151.5 50.2
Leopold East na 50.2
Manifold Heights 167.9 43.0
Moolap 141.4 45.0
Waurn Ponds 167.6 44.0
Whittington 121.2 43.0
Geelong Urban Area Average 152.0 39.8


Post navigation