RAINFALL
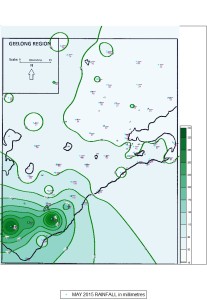
Most of the Geelong-Otways region – except to the north – received average to well above average rainfall for the month. The Bureau of Meteorology’s automatic weather station at Breakwater failed on 3 occasions during the month thereby missing approximately 20 mm of rain, thus affecting their published Geelong total. The rain for Breakwater as computed by Geelong Weather Services for May was 42.4 mm, just above the latest 30-year average 41.5.
Mt Sabine in the Otway Ranges at the head of the Barwon Catchment recorded the amazing 344 mm, well above its average. The storages are therefore at a stationary 57% of capacity, but an increase will be necessary over the winter months.
As far as autumn overall is concerned, this was a drier one than the most recent 30-year average. Geelong received 93 mm over the 3 months compared to the average 109 mm. This corresponds with a slowly drying trend in autumn over the last 30 years.
May isohyet map of region below. Please click to enlarge:

Figures in millimetres
TEMPERATURE
Days in May were cooler than the 30-year average but nights were warmer. Overall the mean May temperature for Geelong was warmer by a mere 0.2 degree C.
Highest temperature reached 22.7 C on the 2nd, and the lowest overnight minimum was 4.4 C on the 26th. The coldest day was the 23rd with a maximum of 12.9 C.
Autumn overall was cooler by 0.3 C than the latest 30-year average temperature. March and April were cooler and May was warmer.
OTHER
There were no storms but 4 days where strong wind gusts exceeded 60 kph. The strongest was 74 kph at Breakwater on the 11th.
RAINFALL DATA
| GEELONG REGION |
 Location Location |
Total for
Month
(mm) |
Monthly
Average
(mm) |
| Aireys Inlet |
62.0 |
(55.6) |
| Anakie |
26.6 |
(52.0) |
| Anglesea |
na |
(63.0) |
| Apollo Bay |
124.4 |
(99.2) |
| Ballan |
52.2 |
(47.5) |
| Ballarat |
38.8 |
(68.1) |
| Bannockburn |
37.4 |
(46.0) |
| Barwon Heads |
61.0 |
(64.0) |
| Bellbrae |
na |
(65.1) |
| Bells Beach |
43.6 |
(65.1) |
| Beeac |
56.0 |
(57.2) |
| Beech Forest |
261.4 |
(181.3) |
| Birregurra |
79.0 |
(64.5) |
| Cape Otway |
155.6 |
(91.7) |
| Colac |
60.2 |
(71.9) |
| Clifton Springs |
41.8 |
(n.a.) |
| Curlewis |
na |
(n.a.) |
| Drysdale |
67.0 |
(48.0) |
| Durdidwarrah |
41.8 |
(59.0) |
| Forrest (West Barwon Dam) |
127.8 |
(108.4) |
| Gellibrand |
215.6 |
(93.7) |
| Inverleigh |
37.0 |
(56.6) |
| Johanna Heights |
na |
(170.0) |
| Lal Lal |
43.0 |
(64.2) |
| Lavers Hill |
na |
(180.0) |
| Melba Gully |
na |
(n.a.) |
| Meredith (Darra) |
45.0 |
(60.2) |
| Moriac |
60.2 |
(55.0) |
| Morrisons |
na |
(na) |
| Mt Cowley |
181.2 |
(na) |
| Mt Mercer |
51.2 |
(na) |
| Mt Sabine |
343.8 |
(na) |
| Pollocksford |
28.6 |
(na) |
| Point Lonsdale |
47.4 |
(57.0) |
| Portarlington |
na |
(58.4) |
| Queenscliff |
na |
(58.1) |
| Scotsburn |
74.0 |
(na) |
| Sheoaks |
30.2 |
(na) |
| Shelford |
34.0 |
(37.0) |
| Skipton |
48.4 |
(44.0) |
| Sutherlands Creek |
21.0 |
(41.0) |
| St Leonards |
43.5 |
(58.0) |
| Teesdale |
na |
(45.2) |
| Torquay |
na |
(58.0) |
| Wyelangta |
327.4 |
(202.7) |
| Winchelsea |
58.8 |
(48.0) |
| You Yangs |
18.5 |
(44.0) |
|
 |
| GEELONG SUBURBS |
 Location Location |
Total for
Month
(mm) |
Monthly
Average
(mm) |
| Avalon |
21.2 |
(40.5) |
| Bell Post Hill |
32.6 |
(40.7) |
| Belmont |
58.0 |
(43.1) |
| Breakwater |
42.4 |
(41.5) |
| Connewarre |
47.5 |
(43.9) |
| Corio |
25.7 |
(41.0) |
| East Geelong |
40.6 |
(43.0) |
| Grovedale |
65.0 |
(45.8) |
| Grovedale South |
66.8 |
(49.8) |
| Hamlyn Heights |
41.1 |
(43.5) |
| Herne Hill |
40.0 |
(40.5) |
| Highton |
45.0 |
(43.8) |
| Lara |
20.0 |
(39.4) |
| Lara (Serendip) |
25.1 |
(39.4) |
| Leopold |
37.0 |
(44.4) |
| Leopold East |
60.0 |
(44.4) |
| Manifold Heights |
44.3 |
(44.4) |
| Moolap |
41.8 |
(46.0) |
| Queens Park |
32.4 |
(41.0) |
| Waurn Ponds |
48.8 |
(45.0) |
| Whittington |
45.2 |
(41.8) |
| Average across Urban Area |
43.0 |
(41.5) |
|


